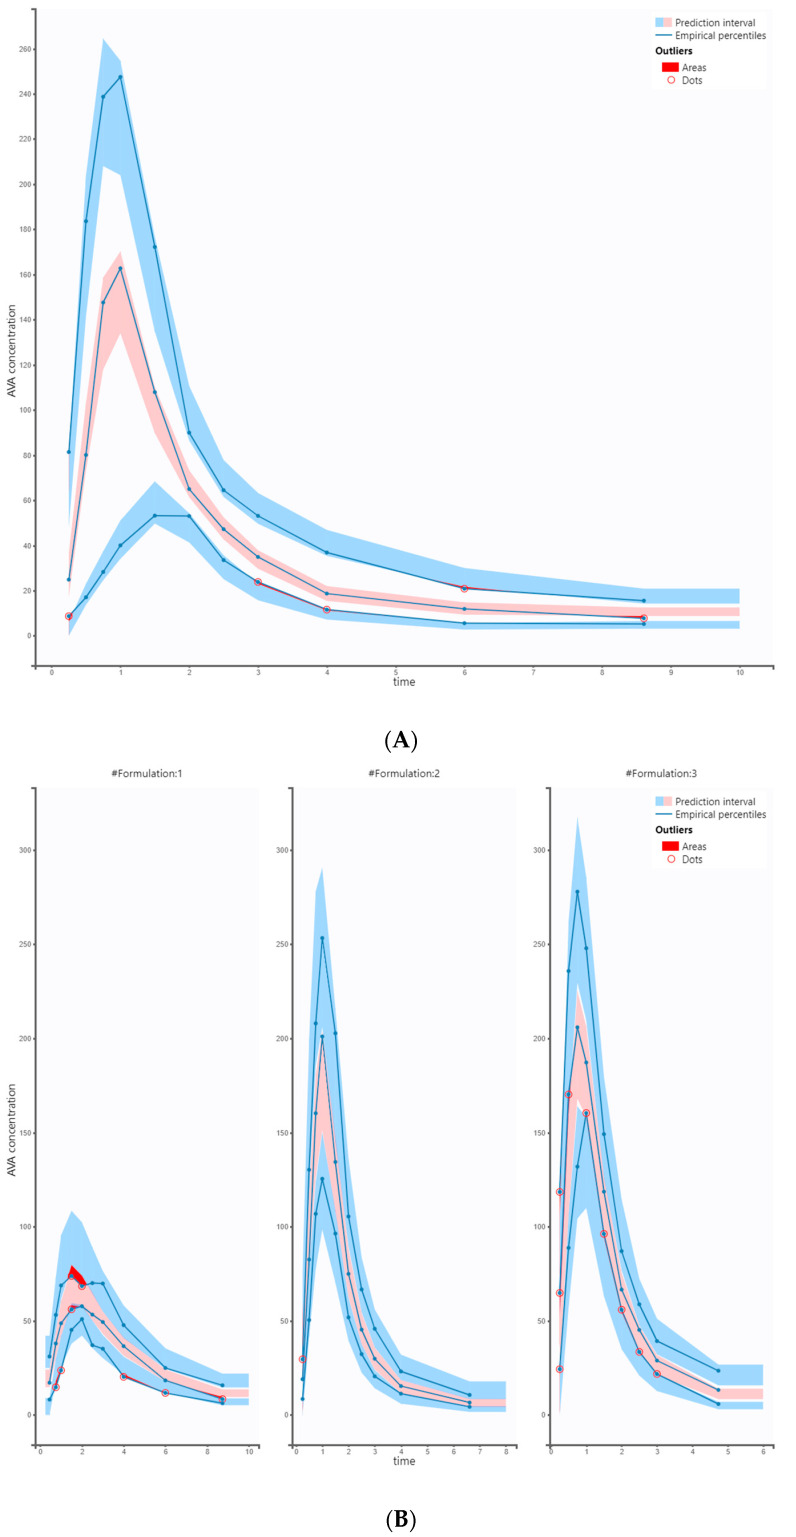
Figure 4.
Plot (A): Joined VPC of AVA. The figure presents the VPC with the prediction intervals for the 10th, 50th, and 90th percentiles. The model describes the observed data well, and model predictions are within the prediction interval. Plot (B): Stratified VPC plots by formulations (#1, #2, #3). Minor outliers were not deemed significant, as the overall model captures the data well. (Concentration of AVA in μg/L, time in h).

