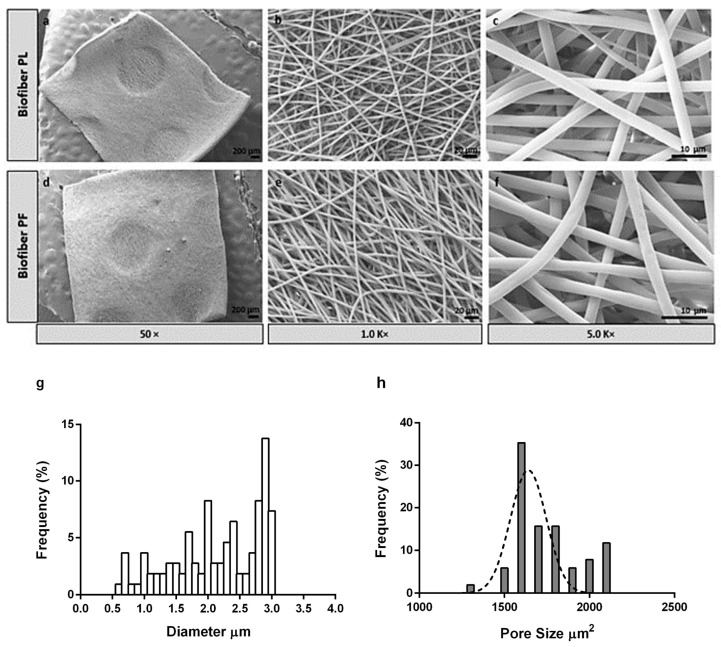
Figure 3.
SEM images of placebo (Biofiber PL, (a–c)) and advanced medicated dressing loaded with pirfenidone 1.5% w/w (Biofiber PF, (d–f)) at different magnifications (50×, 1.0 K×, and 5 K×). (g,h) Graphical representations of Biofiber PF fibers’ diameter frequency %. (g) Histogram with a normal distribution of matrix pore size frequency % (h).

