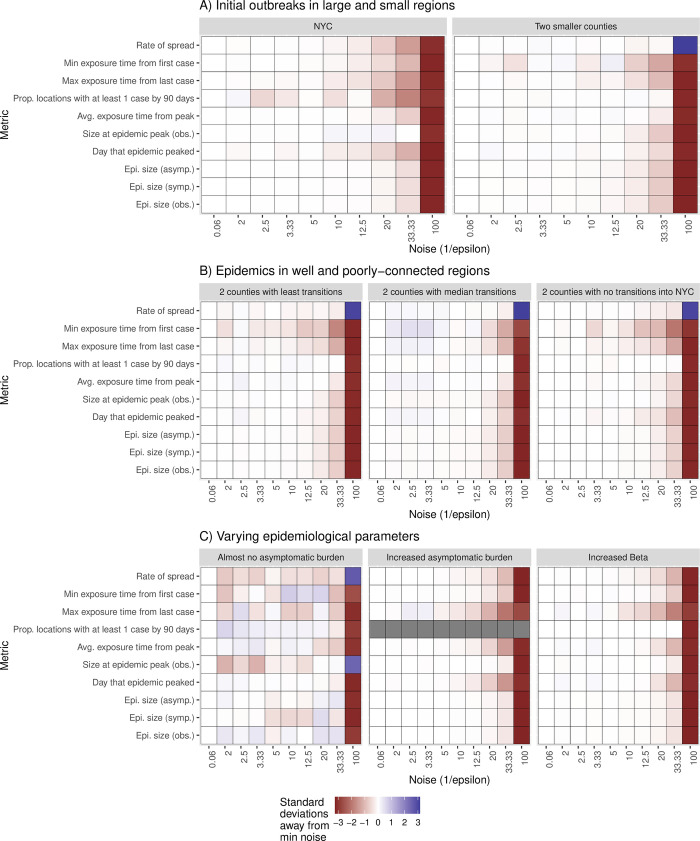
Fig 1.
Metapopulation metric distribution for different values of epsilon for Scenario A: Location of the first cases, B: change in the mobility network, and C: change in the parameters of the metapopulation model. As metrics can exist on very different scales, we calculate the normalized distribution of bootstrapped metrics where a minimum amount of noise is added. We then compare this to the median value of bootstrapped values at increasing values of noise to describe the change from expectation.

