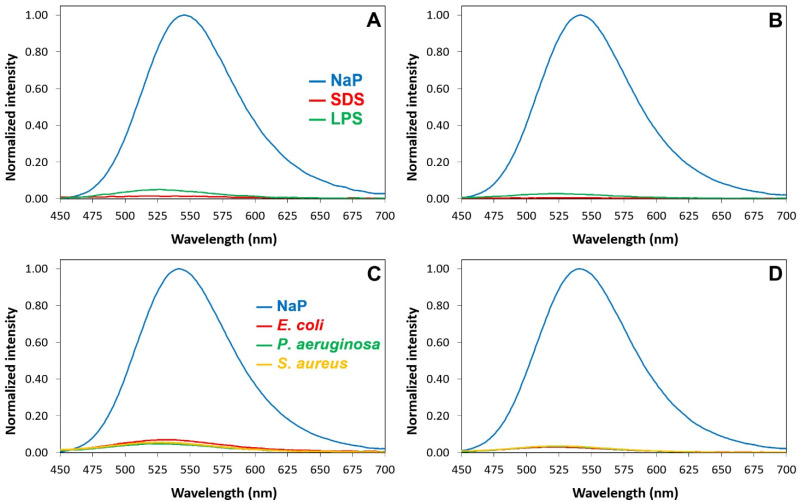
Figure 5.
Emission spectra after excitation at 430 nm of Luc-GKY20 and Luc-P13#1 in the presence of SDS, micellar LPSs or bacterial cells. (A,B) Emission spectra of Luc-GKY20 and Luc-P13#1, respectively, in NaP (blue line), SDS (red line) and LPS (green line). (C,D) Emission spectra of Luc-GKY20 and Luc-P13#1, respectively, in NaP (blue line) or in the presence of E. coli (red line) P. aeruginosa (green line) and S. aureus (yellow line) cells. In each panel, the emissions in the presence of SDS, LPS and bacterial cells were normalized to the emission in NaP.

