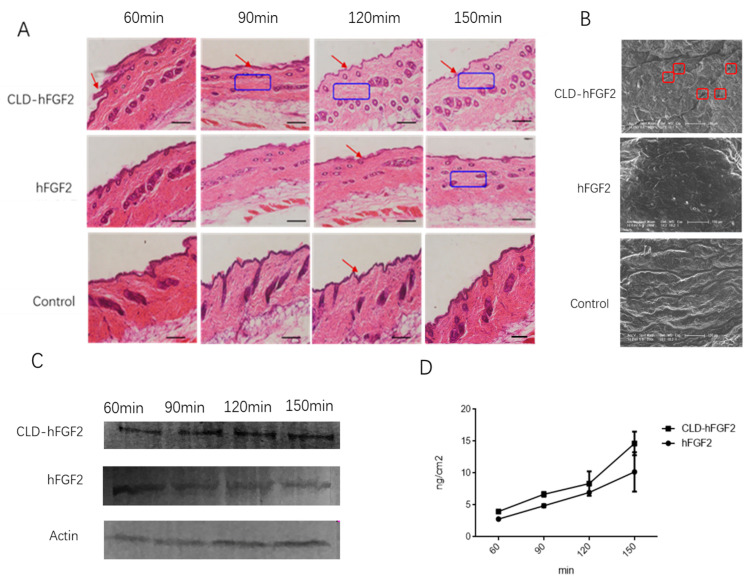
Figure 3.
Evaluation of the cumulative release of CLD-hFGF2 in the skin tissue. (A) Histological diagram analysis of the skin under the treatment of PBS, CLD-hFGF2, and hFGF2. The red arrow shows the changes of the stratum corneum of the skin tissue for different treatment, the blue boxes show how loose the subcutaneous tissue after different treatment contact with the skin tissue. (B) effect of CLD on the stratum corneum of the skin was observed using SEM. The red boxes shows pores in the skin tissue after CLD-hFGF2 was applied to the skin. (C) effect of the absorption of CLD-hFGF2 and hFGF2 freeze-dried powder in the skin at different times using Western blots; and (D) the cumulative release of hFGF2 and CLD-hFGF2 freeze-dry powder in the skin tissue was measured using ELISA. Data are presented as mean ± SD (n = 5; scale bar = 1 µm).

