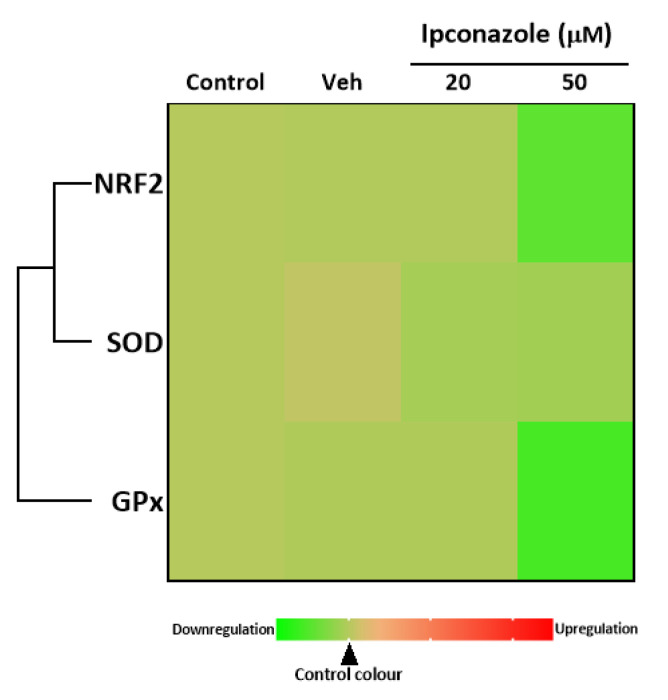
Figure 7.
Heat map of the association between antioxidant biomarkers (NRF2, SOD and GPx) in EA.hy926 cells after 24 h of exposure to ipconazole (20 and 50 µM). The green color scale represents down-regulation, and the red color scale represents up-regulation, relative to vehicle (0.1% DMSO). The solid line is a direct association.

