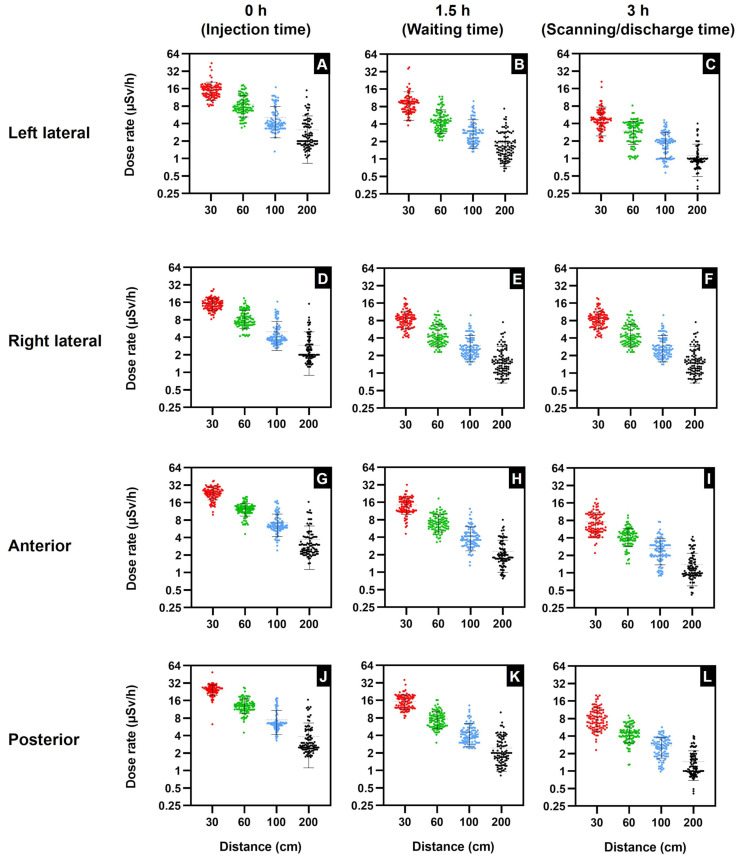
Figure 2.
Scatter plot illustrating the data relationship between dose rate (µSv/h) and distance at 30, 60, 100, and 200 cm at 0 h (injection time), 1.5 h (waiting time), and 3 h (scanning/discharge time). Left lateral: (A) 0 h, (B) 1.5 h, (C) 3 h. Right lateral: (D) 0 h, (E) 1.5 h, (F) 3 h. Anterior: (G) 0 h, (H) 1.5 h, (I) 3 h. Posterior: (J) 0 h, (K) 1.5 h, (L) 3 h. Data are shown as total values with mean ± standard deviation (n = 100).

