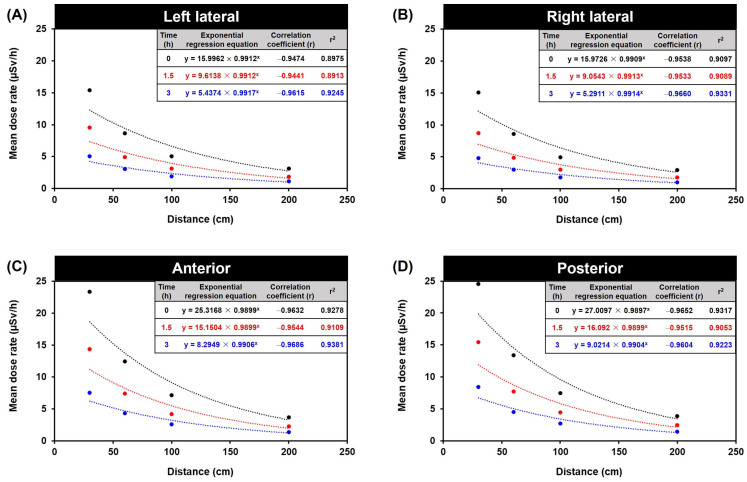
Figure 5.
Forecasting dose based on distance and time after injection in exponential regression equation. The mean dose rate relationship between distance and time: (A) left lateral, (B) right lateral, (C) anterior, (D) posterior. The exponential regression equation is shown in where y is mean dose rate (μSv/h) and x is the distance from the patient (cm).

