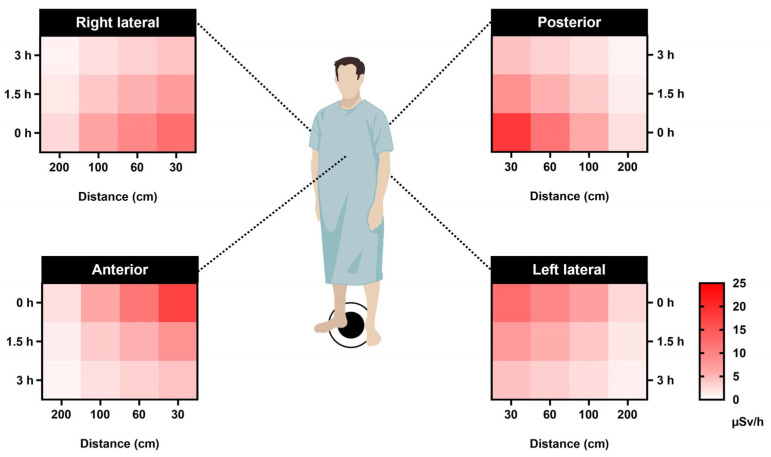
Figure 6.
Forecasting dosage based on distance and time after injection presented as an exponential regression heat map. The correlation between distances (30, 60, 100, and 200 cm) at three different time points—0 h (injection time), 1.5 h (waiting time), and 3 h (scanning/discharge time)—for the left lateral, right lateral, anterior, and posterior orientations. The dose calculation was performed using exponential regression formulas derived from the data presented in Figure 5. These formulas take the form of , where y represents the average dose rate (μSv/h) and x corresponds to the distance from the patient (cm).

