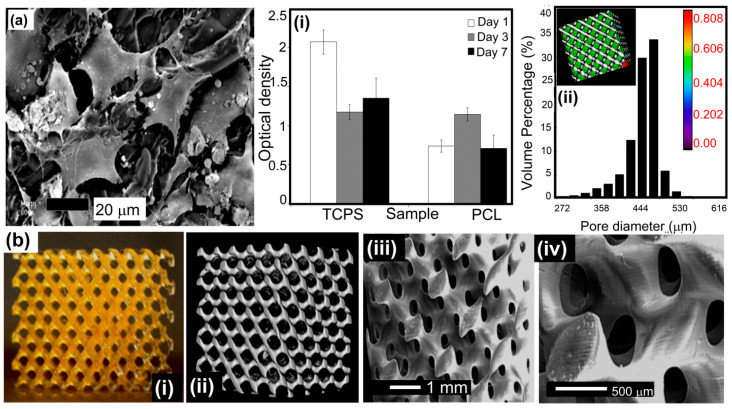
Figure 4.
(a) SEM image: fibroblasts after 7 days in a cell culture showing crosslinked PCL, (i) the activity of cells’ metabolism while grown on TCPS (positive control) and photo-crosslinked PCL networks, and (ii) pore size distribution throughout the porous scaffold via μ-CT. (b) Photographs of (i) a micro-computed tomography visualization and (ii) SEM of a scaffold via SLS using a 1500-m macromer (iii,iv) An enlarged view of the open and linked nature of the porous structure indicates that the scaffold exhibited suitable external and internal surfaces. Reprinted with permission [111].

