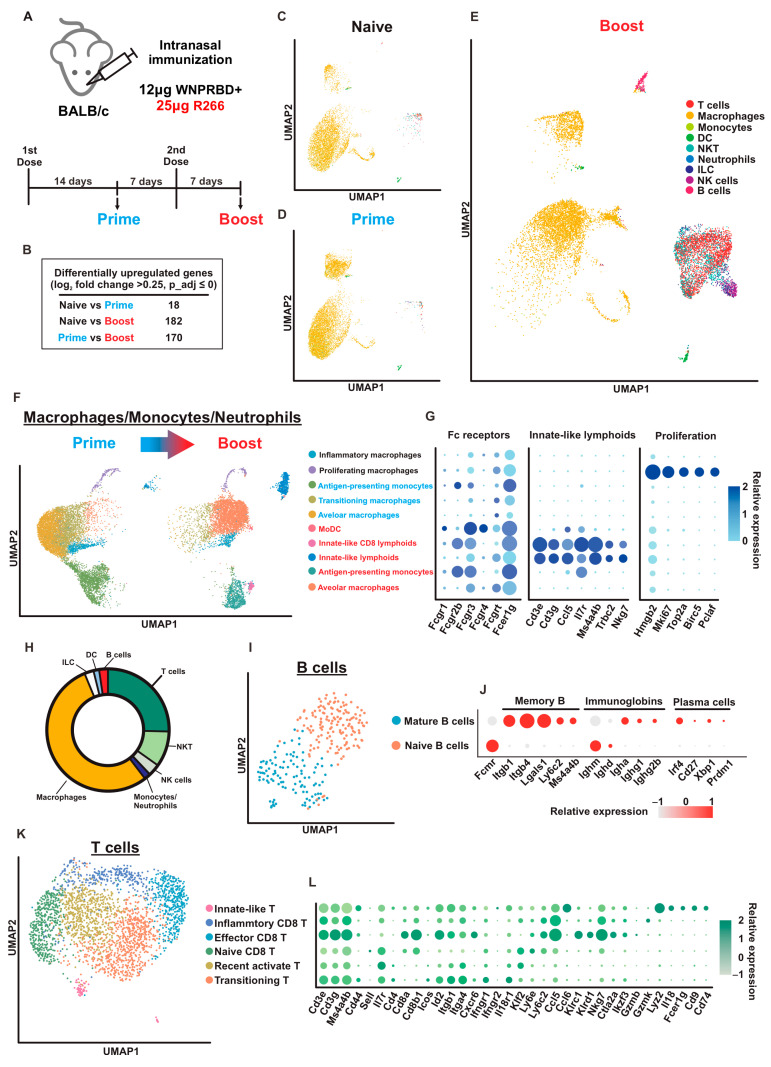
Figure 6.
High resolution immune cell profiling in WNPRBD-R266 intranasal vaccinated mice BALF by single-cell RNA sequencing. (A) Mice (n = 1 for each sample) were immunized with 2 doses of WNPRBD-R266. BALF-flushed cells were harvested at 7 days before 2nd dose (Prime) and 7 days after 2nd dose (Boost). Cells were then subjected to single-cell RNA sequencing. (B) Differentially upregulated gene expression of Naïve, Prime and Boost samples. (C–E) UMAP reduction of Naïve, Prime and Boost clusters. Respective cell identities were highlighted in different colors. (F) UMAP plot of macrophage, monocyte, and neutrophil (MMNs) reclustering. (G) Dotplot representing gene markers expression within MMNs cluster. Prime-specific clusters are highlighted in blue, Boost-specific clusters are red, and clusters appearing in both Prime and Boost are in black. (H) Donut plot of cell type populations in the Boost sample. (I) UMAP plot of Boost B cell reclustering. (J) Differential gene markers within the Boost B cell cluster. (K) UMAP plot of Boost T cell reclustering. (L) Dotplot representing differential gene marker expression in the Boost T cell cluster.

