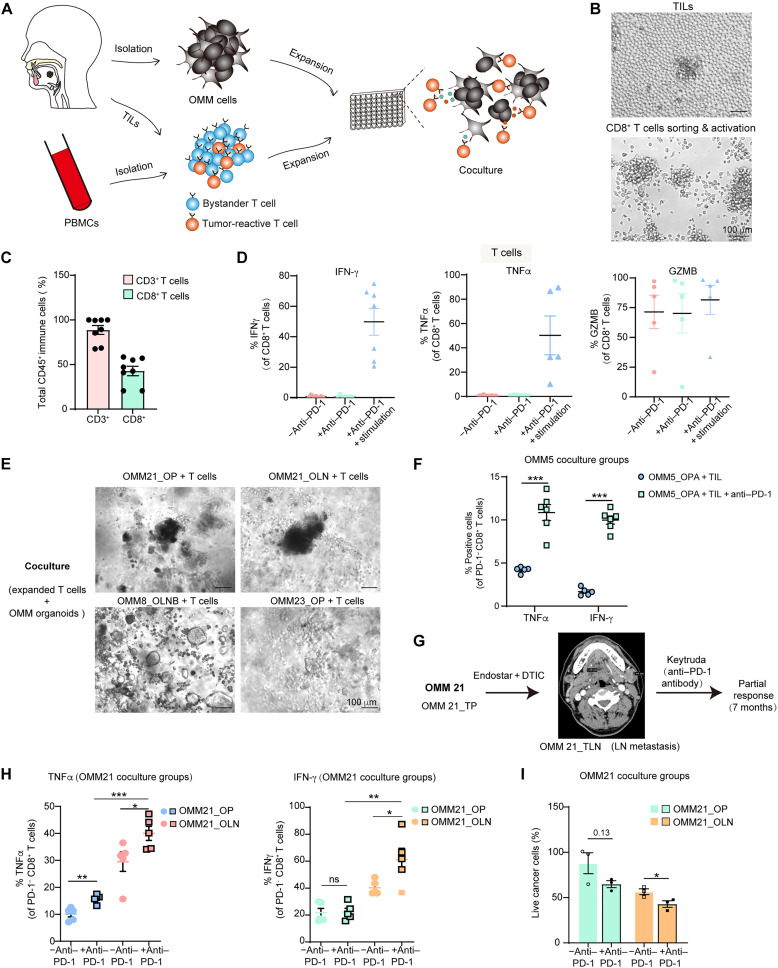
Fig. 6. A coculture system for human OMM organoids and autologous immune cells.
(A) Schematic diagram depicting the generation of organoids, acquisition of autologous immune cells, and establishment of their coculture system. (B) Images showing the morphology of T cells during culture and after activation with anti-CD3 and anti-CD28 antibodies. (C) Percentage of CD3- and CD8-positive cells after 2 weeks of T cell proliferation (n = 8, independent experiments). (D) Percentages of CD8+ T cells positive for granzyme B (GZMB), IFN-γ, and TNFα in the proliferated T cell populations. “−anti–PD-1” refers to no anti–PD-1 antibody (nivolumab) in the culture system, while “+anti–PD-1” indicates the addition of nivolumab in the culture system. “+anti–PD-1 + stimulation” represents the addition of nivolumab and stimulation with PMA and ionomycin in the culture system (n = 7, independent experiments for IFN-γ; n = 5 for TNFα and GZMB). (E) Optical images of small OMM clumps cocultured with T cells. (F) Percentages of PD-1− and CD8+ T cells positive for TNFα and IFN-γ in the OMM5_OPA-P15 organoid and T cell coculture group. (G) Radiation examination and therapeutic schedule for the parental tumors of OMM21 in the clinic. (H) Percentages of PD-1− CD8+ T cells positive for TNFα (left) and IFN-γ (right) in the OMM21_OP-P18 and OMM21_OLN-P11 organoid and autologous T cell coculture group. T cells were acquired after OMM21_TLN TILs cell expansion and CD8+ T microbeads-based cell sorting. (I) Proportions of live cancer cells in OMM21_OP and OLN after coculture with autologous T cells. For (C), (D), (F), (H), and (I), data are presented as the means ± SEM, (F, H, and I) with biologically independent replicates (n = 4 to 6). For (F), (H) and (I), cells were stimulated with PMA and ionomycin. A two-tailed unpaired Student’s t test was used for the P values. *P < 0.05, **P < 0.01, and ***P < 0.001.

