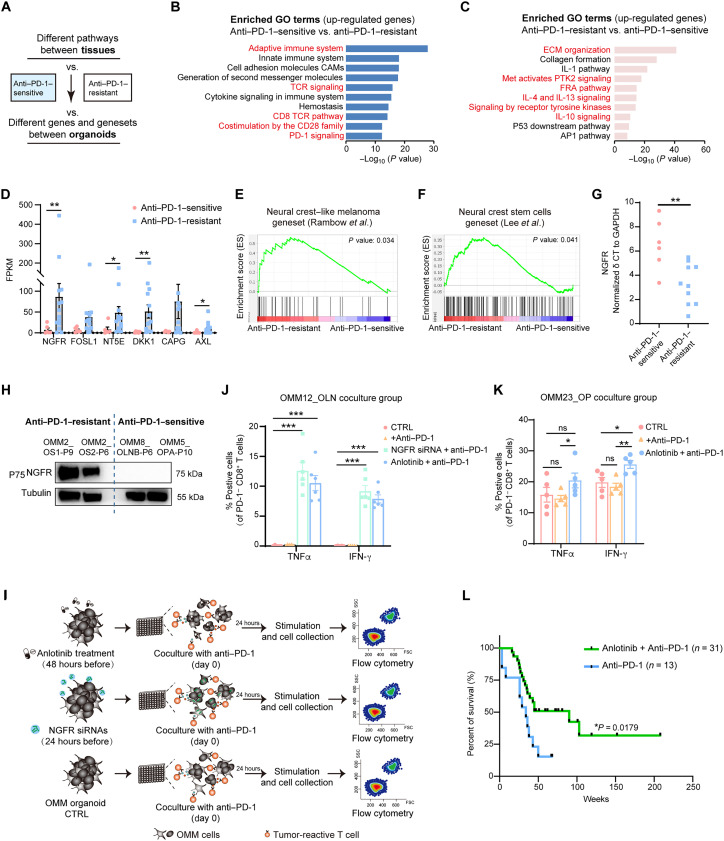
Fig. 7. Combination of anti–PD-1 with inhibition of RTKs or NGFR molecule promotes OMM response to anti–PD-1 therapy.
(A) Flowchart demonstrating the strategies to analyze the transcriptomic differences between “anti–PD-1–sensitive” and “anti–PD-1–resistant” groups. (B and C) Gene pathway analysis of up-regulated DEGs in the anti–PD-1–sensitive (B) and anti–PD-1–resistant (C) groups upon mutual comparison. (D) Average FPKM values for the most variable DEGs in anti–PD-1–resistant OMM organoids compared with anti–PD-1–sensitive OMM organoids. Each dot represents an organoid line. (E and F) GSEA showing enrichment of reported gene sets related to neural crest–like melanoma (E) and neural crest stem cells (NCSCs) (F) in the anti–PD-1–resistant group (for gene set information, see table S5). (G) Delta cycle threshold (δCT) levels (NGFR_ct – GAPDH_ct) for each organoid in the anti–PD-1–resistant and anti–PD-1–sensitive groups. GAPDH, glyceraldehyde-3-phosphate dehydrogenase. (H) Western blotting results demonstrating high expression of NGFR in anti–PD-1–resistant organoids. (I) Schematic illustrating the immune combination treatment in the OMM organoids coculture system for exploring therapeutic effects in vitro. Organoids were treated with NGFR siRNAs or anlotinib before coculture with autologous immune cells and anti–PD-1 treatment (nivolumab). Effective activities of immune cells were assessed after the immune combination treatment. SSC, side scatter; FSC, forward scatter. (J) Percentages of PD-1− and CD8+ T cells positive for IFN-γ and TNFα in the NGFR siRNA- or anlotinib-treated OMM12_OLN-P20 organoid and T cell coculture group. (K) Percentages of PD-1− and CD8+ T cells positive for TNFα and IFN-γ in the anlotinib-treated OMM23_OP-P9 organoid and T cell coculture group. For (J) and (K), “+anti–PD-1” denotes the addition of nivolumab in the culture system. A two-tailed unpaired Student’s t test was used for the P values. *P < 0.05, **P < 0.01, and ***P < 0.001. (L) Kaplan-Meier curves for overall survival of patients with OMM with anti–PD-1 antibody treatment alone or a combination treatment comprising anti–PD-1 antibody and anlotinib. Statistics were calculated using the log-rank test.

