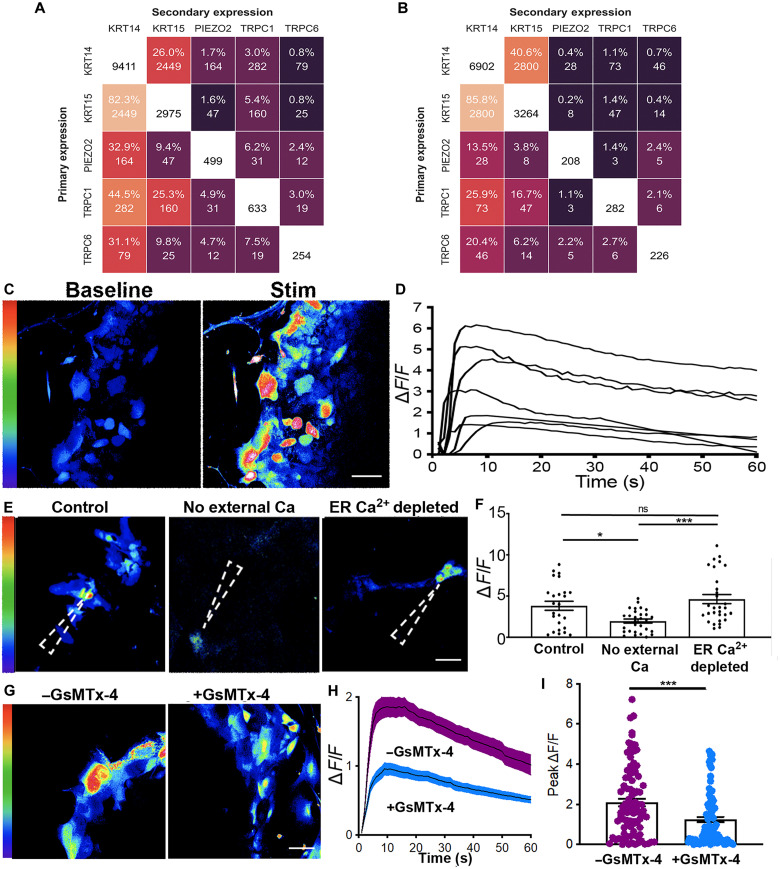
Fig. 2. ORS cells in vitro respond to mechanical stimulus in vitro.
(A) Heatmap depicted coexpression of scRNA-seq data of human scalp hair follicles showing that 5.4% of K15 cells also express TRPC1 (B) Coexpression analysis of scRNA-seq of human skin showing that 1.1% of K14-expressing cells also express TRPC1 (C) Representative images of ORS cells before (baseline) and after they were mechanically activated (stim). (D) ΔF/F traces of mechanically activated calcium transients in ORS cells from (C). (E) Representative images of ORS cells after mechanical activation under +Ca2+ −TPSG (control), −Ca2+ −TPSG (no external Ca2+), and +Ca2+ +TPSG (ER Ca2+ depleted) conditions. The dashed arrowhead shows the point of stimulus. (F) Graph showing peak ΔF/F from n = 2 ORS cultures from two patients (total of 25 to 30 cells in each condition). A one-way analysis of variance (ANOVA) with a Bonferroni post hoc test was performed to compare the peak values of ΔF/F from all stimulated cells across the three conditions. (G) Representative images of ORS cells after stimulation with and without GsMTx-4. (H) Mean ΔF/F traces of mechanically stimulated calcium transients in ORS cells with and without GsMTx-4. (I) Graph showing ΔF/F from n = 7 ORS cultures from four patients (total of 90 cells in the –GsMTx-4 group and 90 in the +GsMTx-4 group). An unpaired t test was used to compare the ΔF/F values in cells within each condition. Scale bars, (C and G) 20 μm and (E) 50 μm. *P < 0.05 and ***P < 0.001. ns, not significant.

