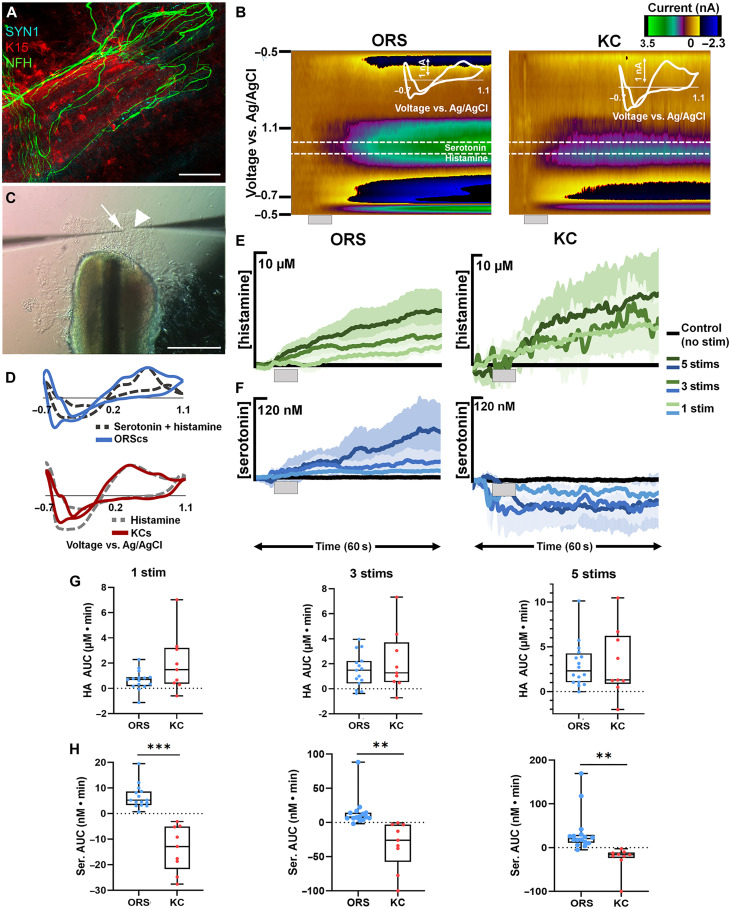
Fig. 4. FSCV analysis of neurochemical release in epithelial cell types.
(A) Whole-mount immunostaining of cleared human follicular units using SYN1, NFH, and K15 antibodies. (B) Representative color plots of stimulated release in ORS cells and keratinocytes (KC) with inset cyclic voltammograms (CVs). Gray bar denotes the time and duration of the stimulation. (C) Image of an ORS cell explant culture with a CFM (arrow) and stim pipette (arrowhead). (D) Normalized CVs from the ORS cells (blue) and a mixed flow injection analysis (FIA) injection of 150 nM serotonin and 5 μM histamine (dark gray dashes) and from the keratinocytes (red) and a FIA injection of histamine (light gray dashes). (E) Average traces of stimulated release of histamine in the ORS cells and keratinocytes from one to five stims (light to dark green). (F) Average traces of stimulated release of serotonin in the ORS cells and keratinocytes from one to five stims (light to dark blue). (G) Box and whisker plots comparing the area under the current versus time curves of histamine (HA) release from the ORS cells (blue) to keratinocytes (red) from one to five stims (left to right). (H) Box and whisker plots comparing the area under the current versus time curves of serotonin (Ser) release from the ORS cells (blue) to keratinocytes (red) from one to five stims (left to right). n = 15 stimulations in five cultures from four patients for ORS cells, while in KC, n = 9 stimulations in three cultures from one patient. **P < 0.01 and ***P < 0.001.

