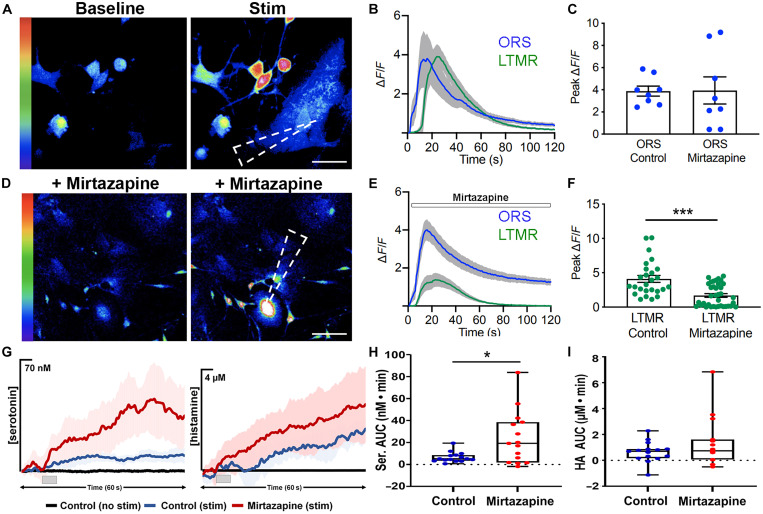
Fig. 5. Serotonin and histamine released from ORS cells can modulate LTMR response.
(A) Images of baseline and stimulated calcium transients in ORS cells and associated LTMRs in coculture. (B) Traces of ΔF/F in ORS cells and LTMRs after mechanical activation of ORS cells. (C) Peak ΔF/F in n = 8 cocultures from three patients (a different ORS cell was stimulated in each coculture). An unpaired t test was used to compare the peak ΔF/F values in control cells and after the drug treatment. (D) Images of baseline and stimulated calcium transients in ORS cells and associated LTMRs in cocultures treated with mirtazapine. (E) Traces of ΔF/F in ORS cells and LTMRs treated with mirtazapine after mechanical activation of ORS cells. (F) Peak ΔF/F in n = 8 cocultures from three patients (total 26 or 36 LTMRs). An unpaired t test was used to compare the peak ΔF/F values of the LTMRs in control and after the drug treatment (different cells within the same culture dish were used under the two conditions). (G) Average traces of stimulated release of serotonin (left) and histamine (right) from ORS cells with one stim. (H) Box and whisker plots comparing the area under the current versus time curves of serotonin release from the ORS cells from one stim. (I) Box and whisker plots comparing the area under the current versus time curves of histamine release from the ORS cells from one stim. n = 15 stimulations in five ORS cultures from four patients. The dashed arrowheads in (A) and (D) show the point of stimulus. Scale bars, (A) 20 μm and (D) 50 μm. *P < 0.05 and ***P < 0.001

