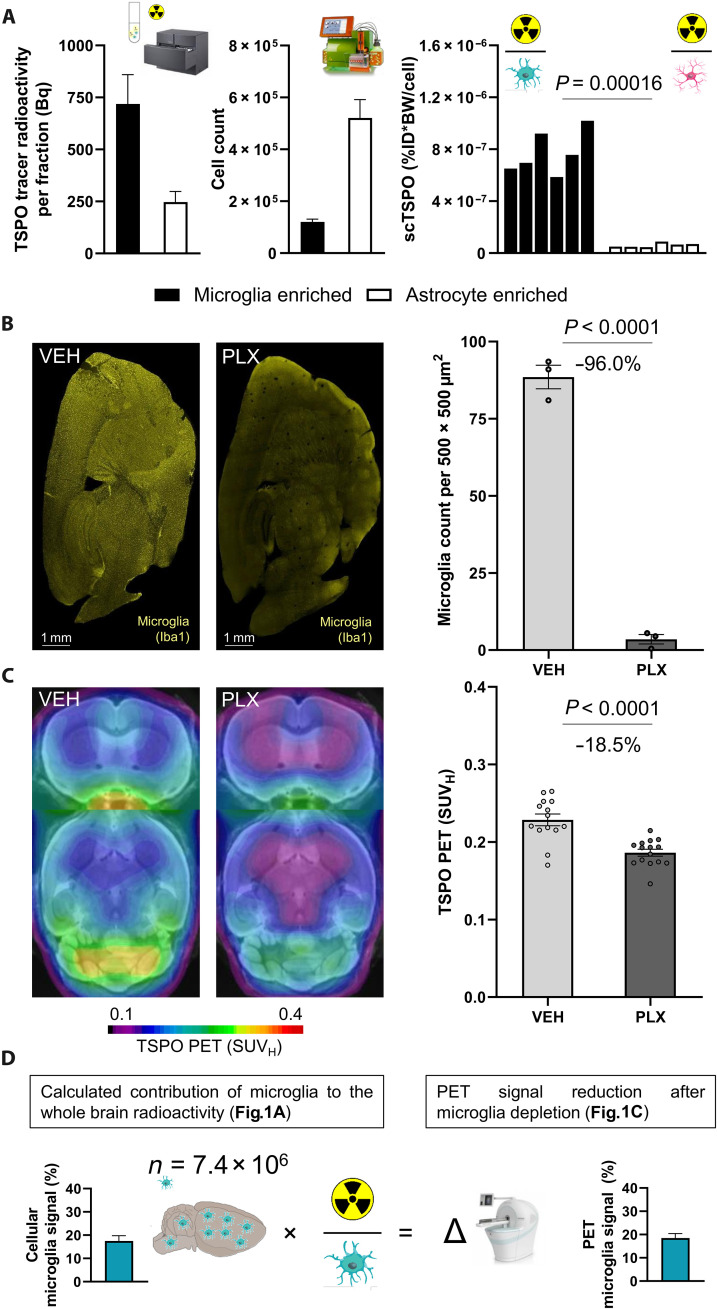
Fig. 1. TSPO-PET signal reduction in the whole brain after microglia depletion corresponds to the whole-brain signal attributable to tracer uptake in microglia.
(A) Components of scRadiotracing after in vivo tracer injection. Upon in vivo tracer injection and magnetic cell separation, cell pellets were analyzed by a high-sensitive gamma counter to measure the radioactivity (in becquerels) in the sample (left) (n = 6, means ± SEM) and by flow cytometry to determine the cell count (middle) (n = 6, means ± SEM). After calculation of radioactivity per single cell [single-cell TSPO tracer (scTSPO), normalized to ID and BW] in each sample, untreated mice showed significantly higher TSPO tracer uptake in microglia when compared to astrocytes (right) (each bar represents a single animal; n = 6, paired t test). (B) Representative sagittal Iba1 immunohistochemistry sections of vehicle treatment (VEH; n = 3) and PLX5622 (PLX)–treated (n = 3) mice and quantification of stained Iba1 area (%). Unpaired t test, means ± SEM. (C) Group average TSPO-PET images of healthy mice upon a magnetic resonance imaging (MRI) template after VEH (n = 14) or CSF1R inhibition (PLX5622; microglia depletion, n = 15) indicated a distinct signal reduction in the whole brain of PLX5622-treated animals (−18.5%). Unpaired t test, means ± SEM. (D) Extrapolation of the signal attributable to microglia using published cell numbers (76) and tracer uptake per single microglia cell as calculated by scRadiotracing. The calculated 17.5% contribution of microglia to the whole-brain TSPO-PET signal corresponded to the observed TSPO-PET signal reduction after microglia depletion (18.5%). Means ± SEM.

