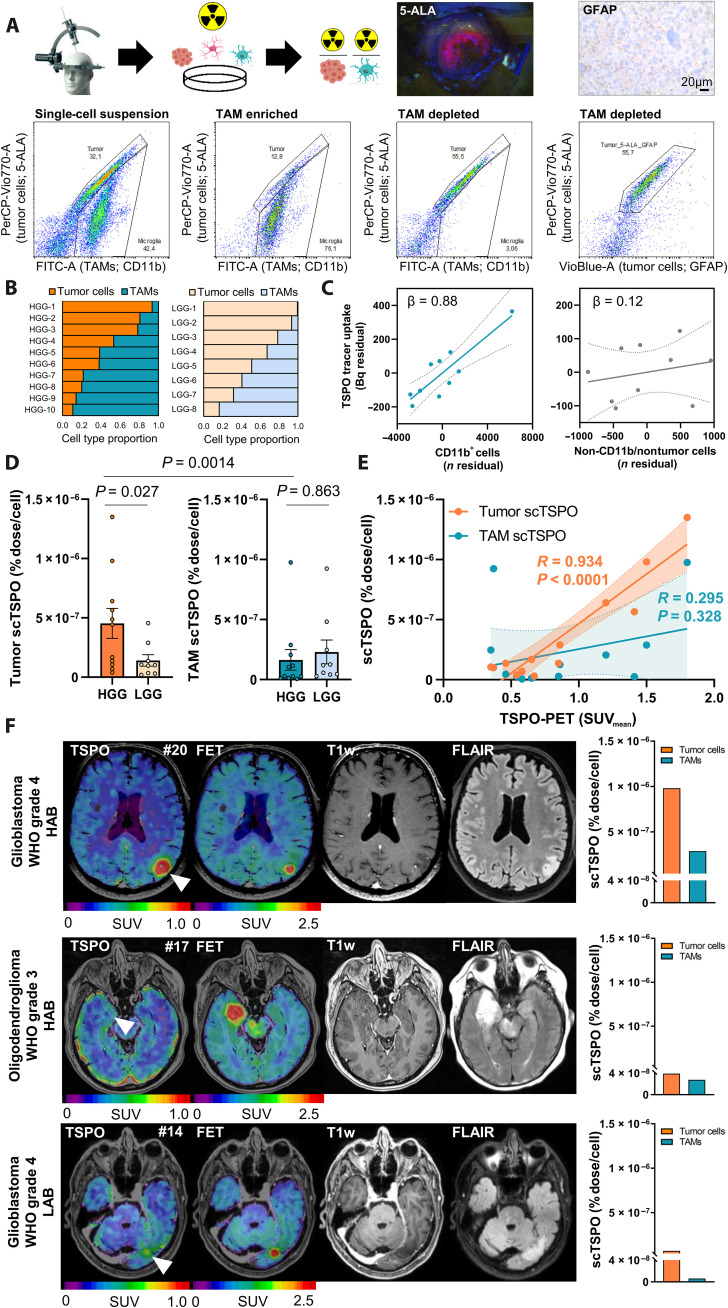
Fig. 4. Translation of scRadiotracing to human glioma samples.
(A) Schematic illustration of the workflow and the gating strategy in human glioma samples (n = 20). The single-cell suspension (left) was separated into TAM-enriched (CD11b+; second from left) and tumor-enriched (third from left) fractions. Tumor cells were defined via glial fibrillary acidic protein (GFAP) or 5-aminolevulinic acid (5-ALA) after confirmation of 5-ALA positivity during surgery or after confirmation of GFAP positivity during neuropathological workup. 5-ALA+ cells colocalized with GFAP+ cells (right). (B) Relative distribution of tumor cells and TAMs in the single-cell suspension of human high-grade glioma (HGG; n = 10) and low-grade glioma (LGG; n = 8) samples. The first two patients did not receive an analysis of the single-cell suspension. (C) Strong contribution of TAMs (CD11b+ cells) but not of CD11b−/nontumor cells to the measured activity (n = 10 biopsy samples). Linear regression, β = standardized regression coefficient. Error bands represent 95% confidence interval. (D) Comparison of scTSPO uptake of tumor cells and TAMs in samples of human HGG (n = 11) and LGG (n = 9) by a multivariate model including tumor grade, age, and sex. Means ± SEM. (E) Correlation of TSPO-PET signals with scTSPO of tumor cells and TAMs. N = 13, R = Pearson’s coefficient of correlation. Error bands represent 95% confidence interval. (F) Three patient examples with similar signals in amino acid [O-(2-[18F]fluoroethyl)-l-tyrosine (FET)] PET and only little contrast enhancement in MRI. The patient with high tumoral TSPO-PET signal [top row, glioblastoma, World Health Organization (WHO) grade-4, high-affinity binding status (HAB), patient #20] showed distinctly more scTSPO compared to the patients with only faint (middle row, oligodendroglioma, WHO grade-3, HAB, patient #17) or low [bottom row, glioblastoma, WHO grade-4, low-affinity binding status (LAB), patient #14] tumoral signal in TSPO-PET.

