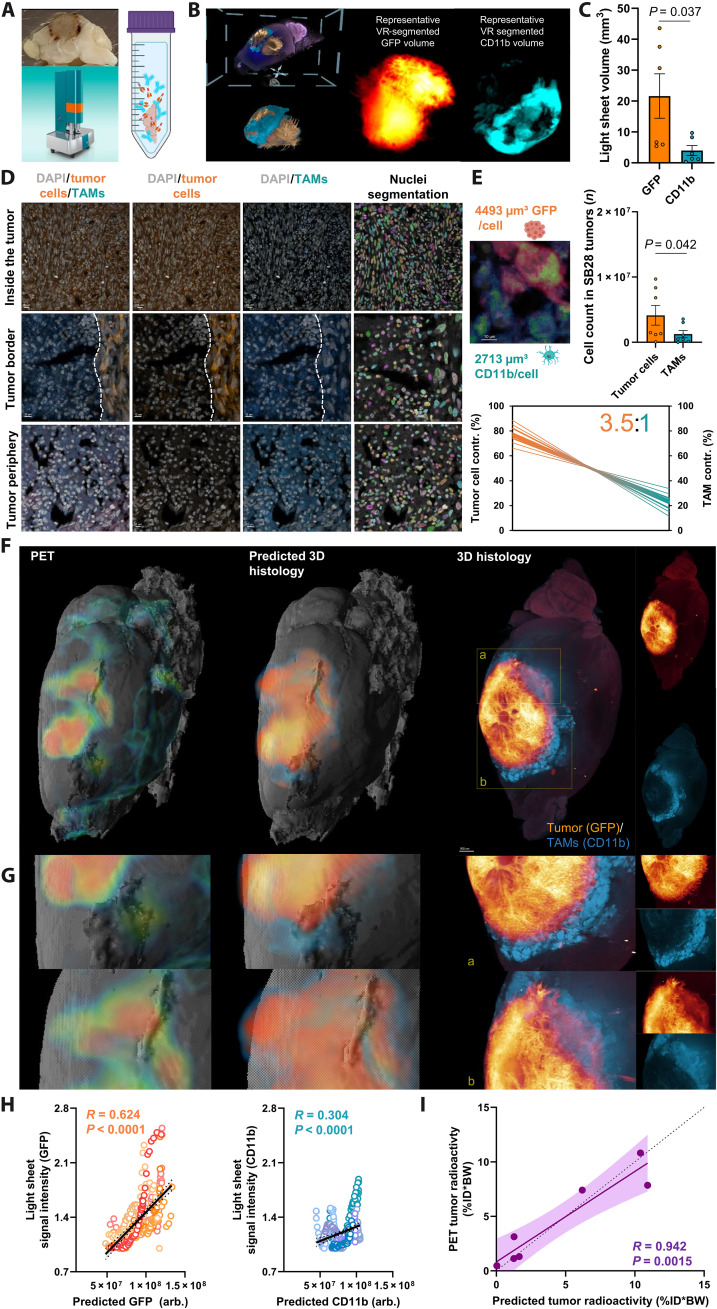
Fig. 5. Integrated analysis of regional PET signals, cellular tracer uptake, and 3D histology.
(A) Tissue clearing with a modified version of 3DISCO (65) and light sheet florescent microscope imaging. (B) Representative masks of tumor cells and TAMs in the virtual reality (VR) annotation tool. This process determined the occupied volume of GFP+ tumor cells and CD11b+ TAMs within the whole tumor using segmentation via syGlass (69). (C) Quantitative comparison of GFP+ and CD11b+ volumes within individual SB28 tumors (n = 7, paired t test). (D) Confocal microscopy determined the average GFP+ volume per single tumor cell and the average CD11b+ volume per single TAM. Nuclei segmentation using cellpose (68) determined cell numbers per section (right column). (E) Quantitative comparison of the absolute tumor and TAM cell count (n = 7, paired t test) and contribution of tumor cells and TAMs to the overall TSPO-PET signal (3.5:1). Thick lines indicate the mean of scTSPO × top/bottom standard error of the mean (SEM) band of tumor volumes; thin lines indicate top/bottom SEM band of scTSPO × top/bottom SEM band of tumor volumes. (F) Regional TSPO-PET signals (left) were combined with single-cell tracer uptake values of tumor cells and TAMs to predict cell type abundance within individual SB28 tumors (middle) with validation by light sheet microscopy (right). All mice are illustrated in fig. S7. (G) Representative magnified areas within the SB28 tumor underline the regional agreement between predicted and standard of truth 3D histology. (H) Correlation of predicted and standard of truth 3D histology within k-means clusters (Fig. 3). n = 350 single regions from n = 7 tumors. R = Pearson’s coefficient of correlation. Error bands represent 95% confidence interval. (I) Prediction of radioactivity measured in PET by cellular abundance and cellular tracer uptake. R = Pearson’s coefficient of correlation. Error bands represent 95% confidence interval. Dashed line represents line of identity (y = x).

