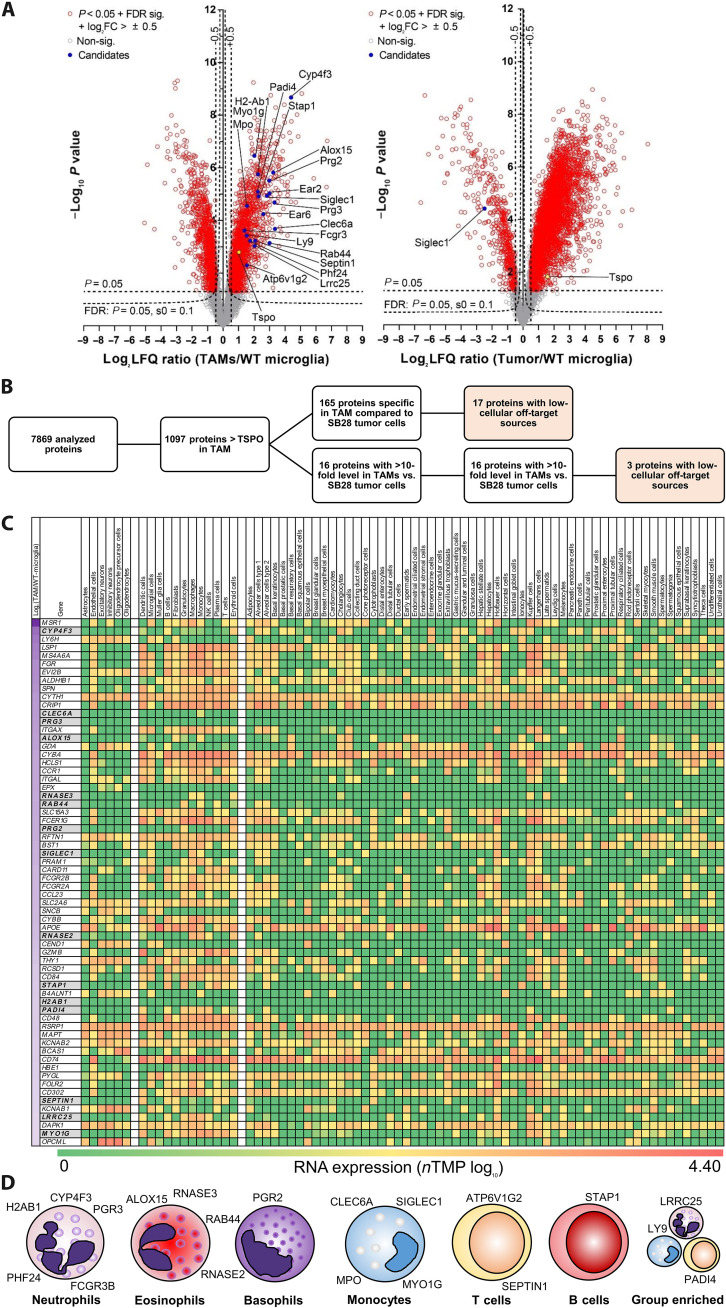
Fig. 6. Proteome analysis of the SB28 TME identifies TAM-specific radiotracer targets for glioblastoma.
(A) Volcano plot representation of the different protein levels in isolated TAMs (n = 5) and isolated SB28 tumors cells (n = 3) in comparison with control microglia isolated from age-matched mice (WT-microglia; n = 6). TSPO (yellow) showed intermediate elevation of protein levels in TAMs and SB28 tumor cells. A total of 1098 of 7869 analyzed proteins indicated higher protein levels in TAMs than did TSPO. FC, fold change. (B) Selection process of potential radiotracer targets for specific detection of TAMs over SB28 tumor cells. A total of 165 of the identified proteins in TAMs were not detected in SB28 tumor cells, and another 16 proteins had >10-fold higher levels in TAMs compared to SB28 tumor cells. A total of 20 proteins showed low-cellular off-target sources and were identified as potential TAM radiotracer targets. (C) Heatmap screening for TAM specificity of the 181 proteins of interest. The Human Protein Atlas (17) was used to determine RNA expression levels of all proteins of interest in (i) resident off-target cells of the brain (left cell type columns), (ii) resident and infiltrating cells in the presence of glioblastoma (middle cell type columns), and (iii) off-target cells of the organism (right cell type columns). Genes are sorted by protein level differences in TAMs compared to control microglia of untreated mice (top to bottom; log2 label-free quantification ratio; first column). Sixty-four proteins with highest elevation [log2 (TAMs/WT-microglia) > 2; left column] are illustrated in (C) and all proteins are provided in fig. S8. Proteins of interest are highlighted in gray. (D) Immune cell expression cluster allocation of proteins of interest. Single-cell RNA data of the Human Protein Atlas were used to categorize the final set of identified proteins.

