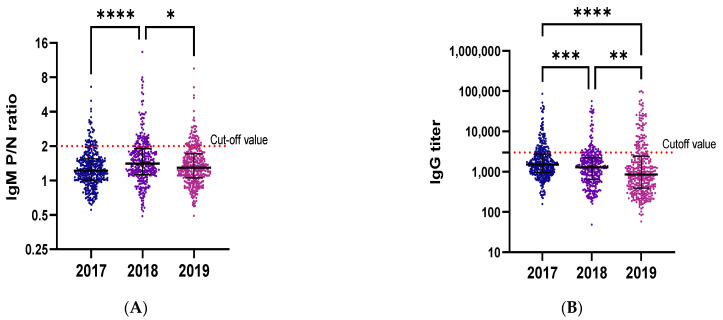
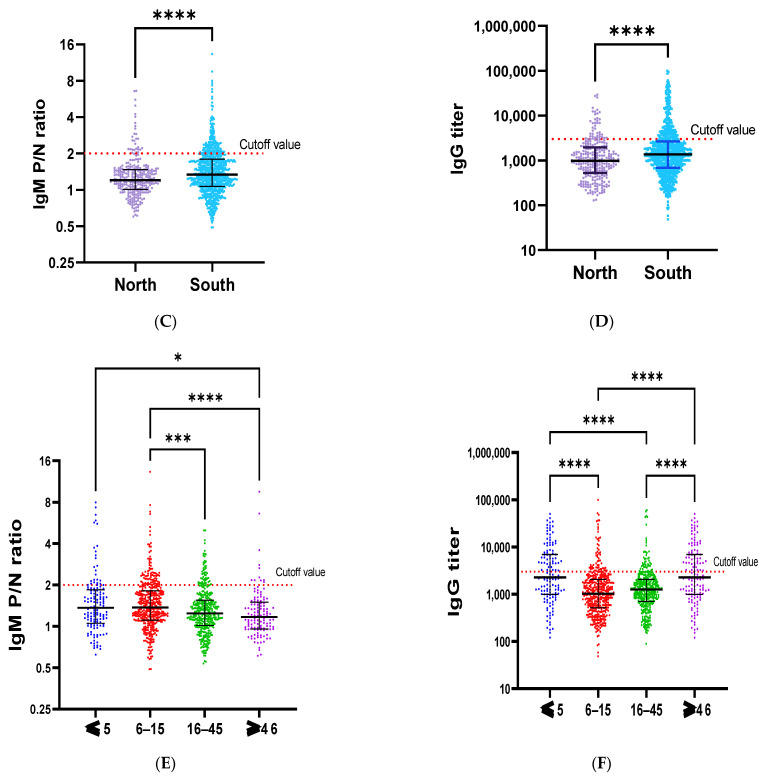
Figure 3.
Distribution of IgM P/N ratios and IgG titers over the years, across regions, and age groups. Distribution of the IgM P/N ratio and IgG titer was investigated over the years (A,B), across the regions (C,D), and across age groups (E,F). The P/N ratio is the ratio of the optical density (OD) of the sample to the OD of the negative control. The cutoff value is the red dot line with P/N ratio of 2 for IgM, and titer of 3000 for IgG. The samples with a titer or P/N ratio higher than the cutoff value were considered as positive. p value is defined as follows * p ≤ 0.05; ** p ≤ 0.01; t *** p < 0.001 and **** p < 0.0001.


