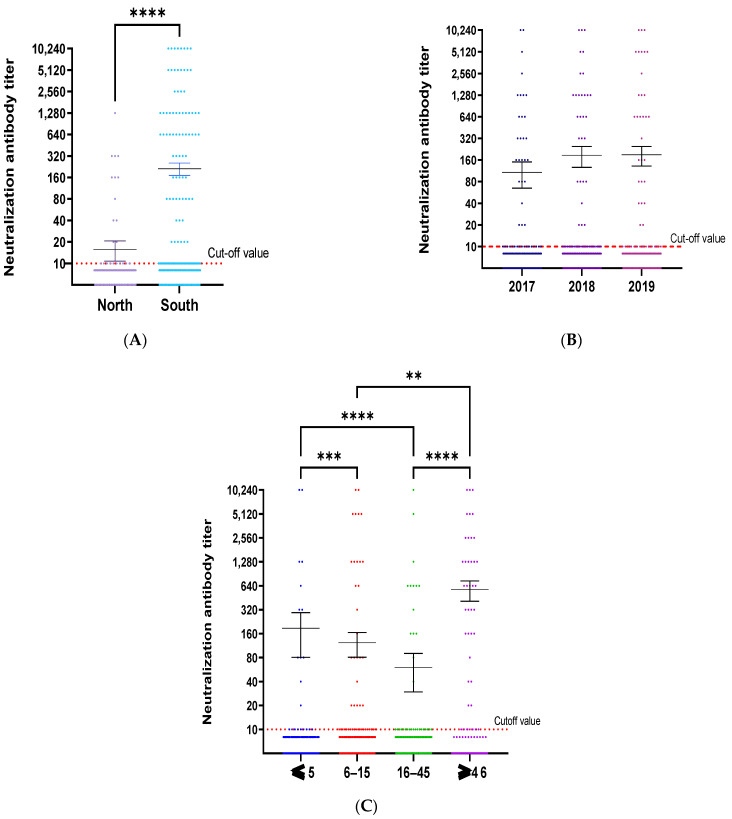
Figure 4.
Neutralization titer distribution by regions, years and age groups. The distribution of neutralization titer by regions (A), years (B), and age groups (C) is shown. The cutoff value was defined as the red dot line corresponding to a value of 10 for neutralization antibody titer. The sample with a titer higher than the cutoff value was considered as positive. The mean of CHIKV-neutralizing antibodies was compared by regions, years, and age groups using the Kruskal–Wallis test, with the Dunn-Bonferroni correction method for multiple comparison tests. p value was defined as follows ** p ≤ 0.01; *** p < 0.001 and **** p < 0.0001.

