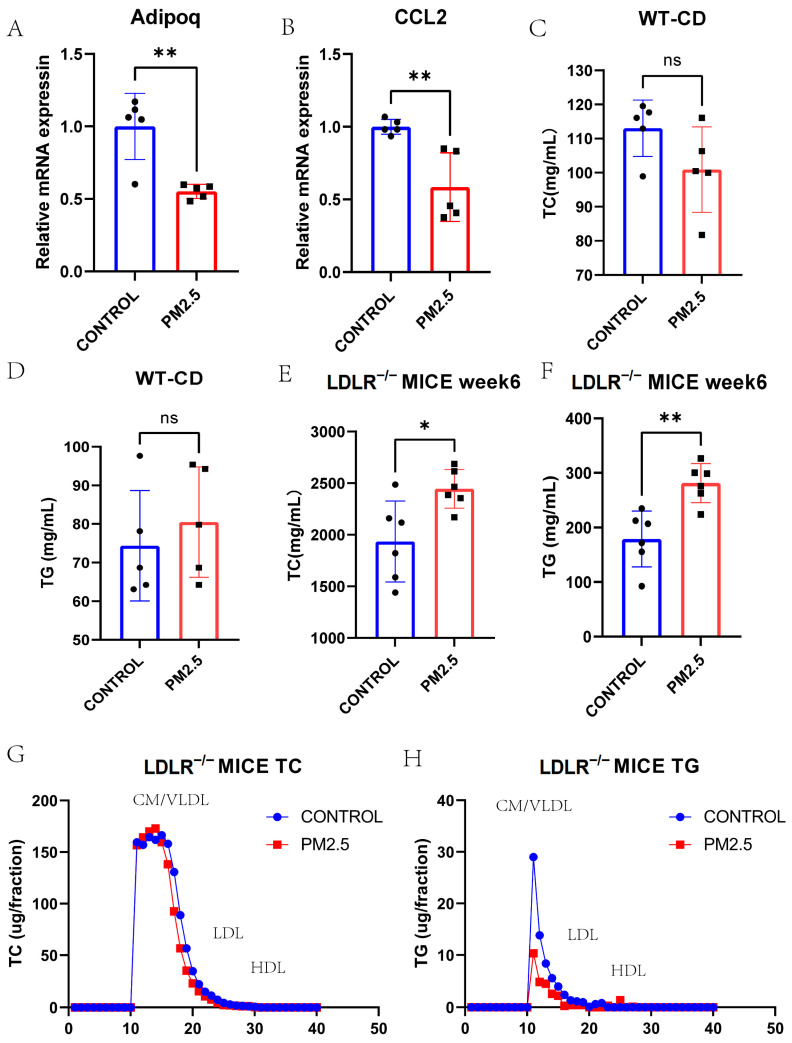
Figure 7.
(A) QPCR result of Adipoq in PM2.5-intranasal-instilled mice liver and controls (p = 0.003). (B) QPCR result of Ccl2 in PM2.5-intranasal-instilled mice liver and controls (p = 0.005). (C–F) Fasting plasma TG and TC levels of PM2.5 intranasal instilled WT chow-diet-fed or LDLR−/− HFD-fed mice and controls (p = 0.517, 0.109, 0.003, and 0.017, respectively). (G,H) The distribution of TC and TG in pooled plasma samples of PM2.5 intranasal instilled LDLR−/− HFD-fed mice and controls. TC, total cholesterol; TG, triglyceride; WT, wild type; HFD, high fat diet. * p < 0.05, ** p < 0.01.

