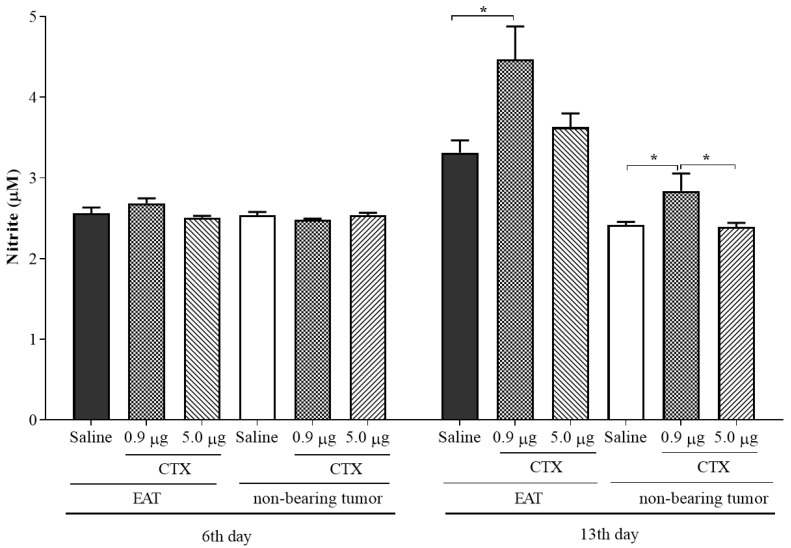
Figure 4.
Effect of CTX on nitric oxide production. The animals were inoculated with EAT (1 × 10⁷ cells/0.5 mL PBS) or injected, i.p., with PBS (non-tumor-bearing animals) and treated concomitantly with different doses of CTX (0.9 µg/animal and 5.0 µg/animal in 100 µL saline, s.c.) or saline (100 µL). After the 6th or 13th day of tumor cell inoculation, the supernatant from each group was transferred to a reading plate and Griess reagent (1:1, v/v) was added. Then, the plate was read in an ELISA reader at 550 nm. The reading values were compared with a standard curve of sodium nitrite (NaNO2) and the results were expressed as µmoles of nitrite in the ascitic fluid (tumor-bearing animals) or in the peritoneal lavage of the non-tumor-bearing animals. Values are expressed as mean ± SEM of 4–9 animals per group. * p < 0.05, compared to the respective control (EAT + saline and PBS + saline) and the experimental groups treated with CTX.

