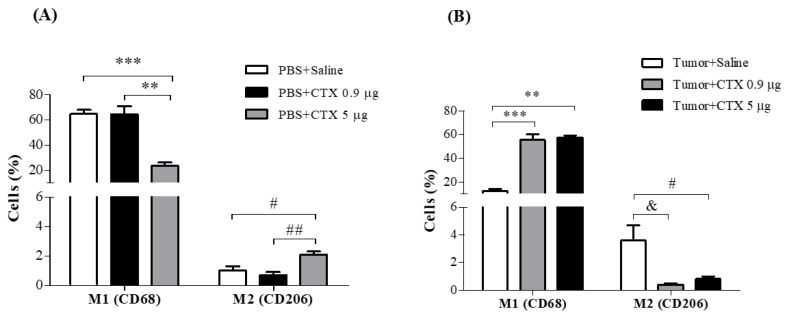
Figure 5.
Effect of CTX on macrophage reprogramming. (A) Animals injected intraperitoneally with PBS (0.5 mL) (non-tumor-bearing animal group) and (B) tumor-bearing animals group (inoculated with EAT 1 × 10⁷ cells/0.5 mL); both were treated concomitantly with different doses of CTX (0.9 and 5.0 µg/animal in 100 µL of saline, s.c.) or saline (100 µL). On the 13th day of inoculation with PBS or tumor cells and concomitant treatment with CTX, the adherent cells from the intraperitoneal cavity were incubated with different mAbs for the macrophage phenotypes (anti-CD45, anti-F4/80, anti-CD68 and anti-CD206) labeled with distinct fluorophores and analyzed by flow cytometry. Values are expressed as the percentage of positive cells ± SEM of 4–6 animals per group in the figures of M1 and M2 phenotypes. ** p < 0.05, compared to the group treated with the dose of CTX 0.9 µg/animal. # p < 0.05, compared to the control group (saline). & p < 0.01, compared to the control group (saline). ## p < 0.05, compared to the group treated with CTX. *** p < 0.001, compared to the control group (saline).

