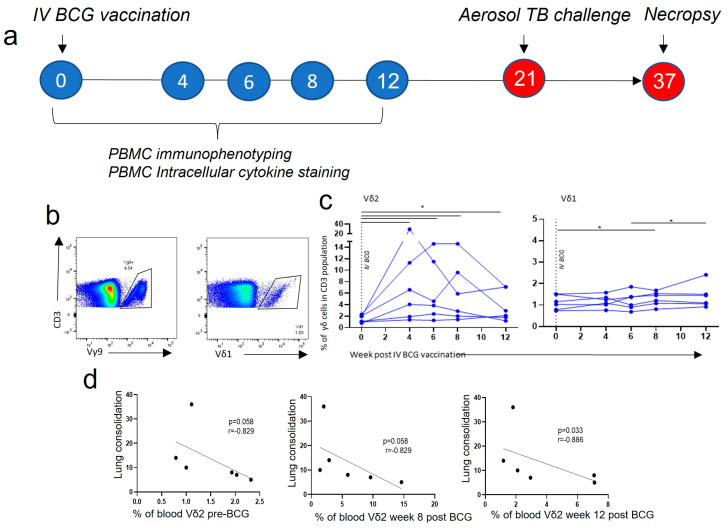
Figure 2.
γδ T cells in the circulation after IV BCG vaccination. (a) Outline of the experimental study design. (b) Gating strategy of Vδ2+ (Vy9+) and Vδ1+ T cells from live CD3+ lymphocytes. (c) The proportion of Vδ2 and Vδ1 cells within the CD3+ population in the circulation 4, 6, 8 and 12 weeks after IV BCG vaccination. Data points represent individual animals. Asterisks represent significant differences between indicated timepoints, determined with Wilcoxon tests (p < 0.05). Correlations between Vδ2+ (d) proportions in the circulation and TB disease and health outcomes were carried out using Spearman correlation tests, with the r and p-value shown.

