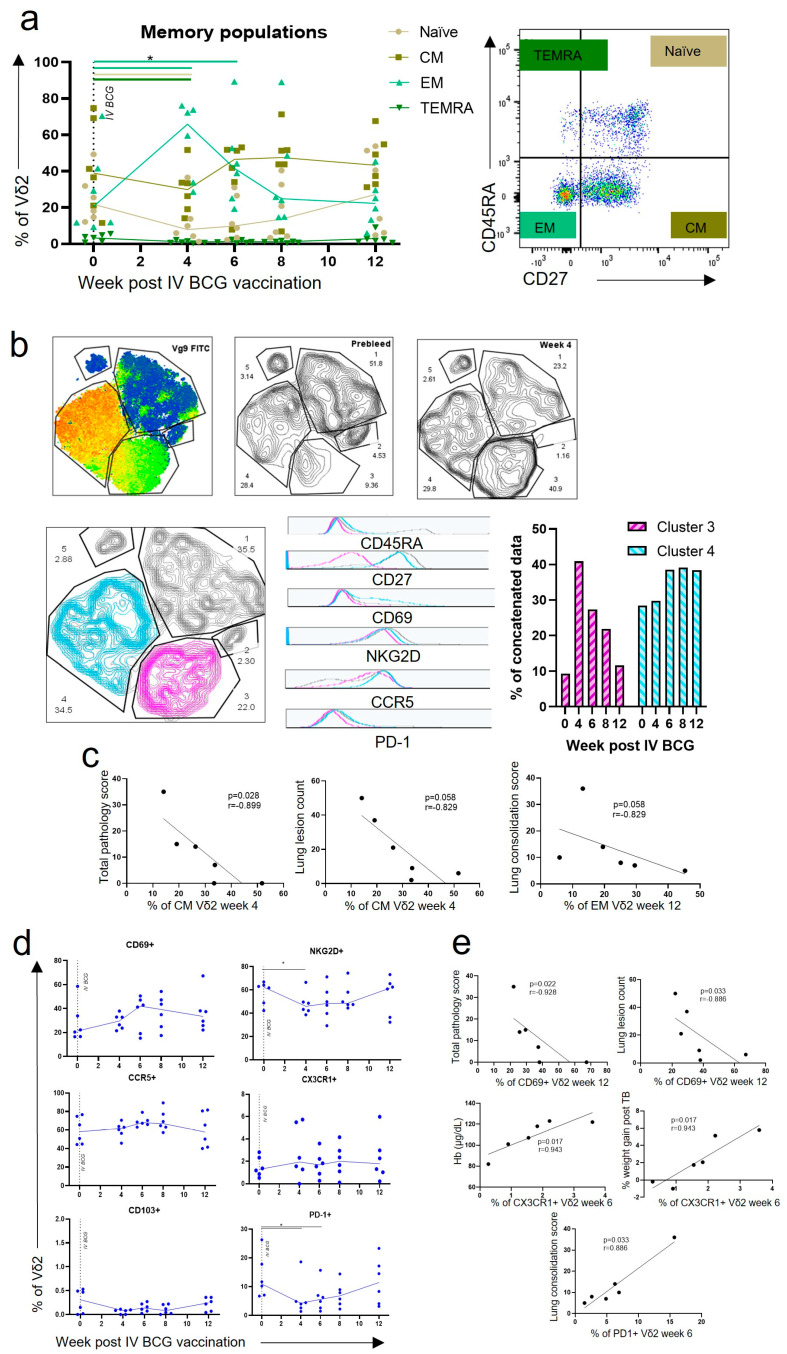
Figure 3.
Phenotypic changes of Vδ2 cells after IV BCG vaccination. (a) Immunophenotyping flow cytometry assays were utilised to assess changes in memory profiles. Each dot represents one individual. Asterisks represent significant differences between indicated timepoints, determined with Wilcoxon tests (p < 0.05). Provided is a representative example of memory profile gating using CD27 and CD45RA expression. (b) Phenotypic data from all timepoints were concatenated before dimensionality reduction was performed using tSNE. The heatmap shows the resulting five manually gated clusters. Vδ2 cells are in clusters three and four. The proportion of cells within clusters prior to vaccination and 4 weeks after vaccination is shown. The bar chart shows how the proportion of cells within clusters three and four changes over the course of the vaccination phase. The histograms show the expression of the indicated phenotypic marker in cluster three (pink) and cluster four (blue). (c) Spearman correlation tests were used to interrogate associations between memory profiles and TB disease or health measures; p-values and r values are shown. (d) Immunophenotyping assays were also utilised to assess changes in activation, homing and exhaustion markers. (e) Spearman correlations were used to interrogate associations between activation, homing and exhaustion markers and TB disease or health measures. p-values and r values are shown.

