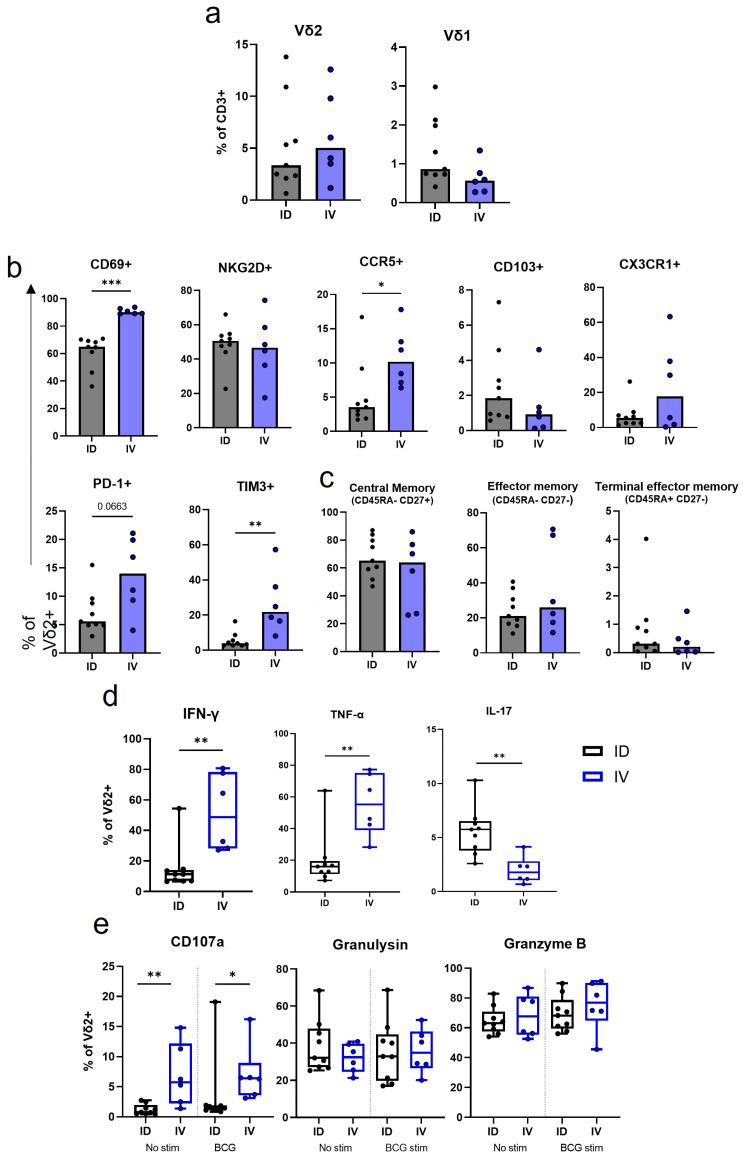
Figure 6.
BAL Vδ2 T cell frequency, phenotype and function after ID or IV BCG vaccination. Immunophenotyping and functional flow cytometry panels were applied to BAL mononuclear cells 8 or 9 weeks post IV (blue) or ID (black) BCG vaccination. (a) The proportion of BAL Vδ2 cells and Vδ1 cells in the BAL after BCG vaccination. (b) The proportion of Vd2 cells expressing activation, homing and exhaustion markers in the BAL. (c) The proportion of Vδ2 memory profiles. (d) The proportion of BAL Vδ2 cells producing IFN-γ, TNF-α and IL-17 after IV or ID BCG vaccination. Values represent results from ex vivo BCG-stimulated cells minus results from cells without ex vivo stimulation. (e) Proportion of Vδ2 cells expressing CD107a, or producing granulysin, or granzyme B. Shown are results without any ex vivo stimulation, and with an ex vivo BCG stimulation, minus results in unstimulated wells. Mann–Whitney U tests were used to test differences between the vaccination routes. A significant p-value is denoted by asterisks, with * = p < 0.05, ** = p < 0.01 and *** = p < 0.001.

