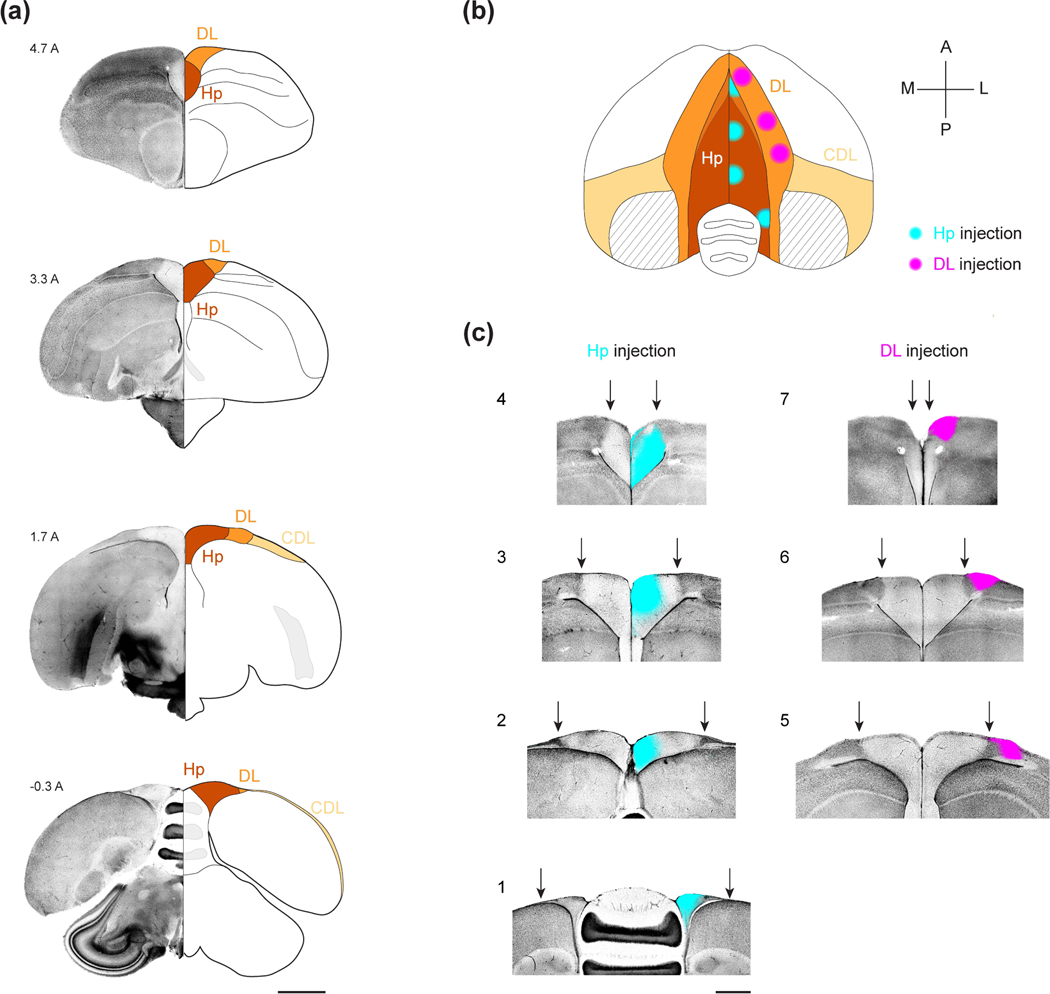
Figure 1: The HF of the black-capped chickadee.
(a) Coronal sections of the chickadee brain illustrating the boundaries of HF. For each coronal section, the left hemisphere is shown in DAPI stain and the right hemisphere is shown as a section with labeled landmarks. Numeric label indicates the coordinate in mm anterior to lambda. Note the change in cell density between Hp and DL. Also note that, in the anterior-most section, Hp does not extend to the dorsal surface of the brain and is bordered dorsally by DL. In the posterior-most sections, DL is very small, and CDL extends into an extremely thin layer at the brain surface. Scale bar: 2 mm.
(b) Horizontal projection of the brain indicating the seven CTB injection locations used in this study. Stereotaxic coordinates of each injection are indicated in Table 1. CTB spread (~750 μm diameter bolus) is indicated by cyan (Hp) and magenta (DL) circles. Striped area indicates the portion of CDL that is a thin fiber tract containing no cell bodies. At anterior positions, DL is dorsal to the hippocampus and overlaps with it in horizontal projection (blended color). At posterior positions, Hp is party dorsal to the cerebellum; the cerebellum is partially occluded at its lateral-most positions.
(c) Example coronal sections of each of the seven injection locations shown in (b). For each section, DAPI stain (grayscale) is merged with CTB fluorescence (cyan for Hp injections, magenta for DL injections). Arrows: boundary of Hp and DL. We did not observe CTB spreading across the midline or across the boundaries of Hp and DL, presumably due to cytoarchitectural differences with the surrounding structures, which are particularly strong in chickadees. Injection locations are numbered the same way as in Table 1. Scale bar: 1 mm.

