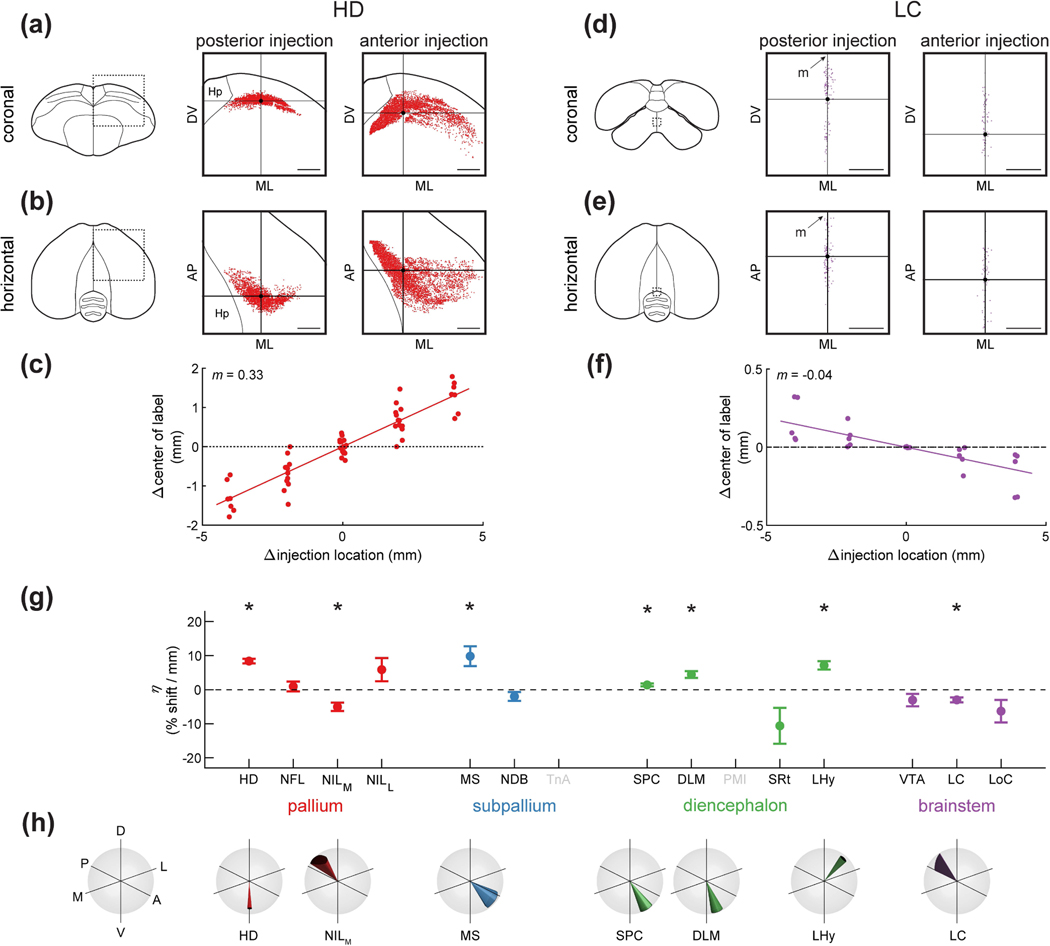
Figure 10: Topographic differences of inputs to HF.
(a) Left: schematic of a coronal section, with the region of interest shown by a dotted rectangle. Center and right: retrogradely labeled neurons from paired posterior and anterior injections at locations 2 and 4 (Table 1) respectively. This is a projection of all labeled HD cells from all coronal sections of the brain, not only the section shown on the left. Horizontal and vertical lines denote the mean coordinates of the labeled cells, respectively. Scale bars: 1 mm.
(b) Same as (a), but for the horizontal projection of the brain. A random jitter between −50 μm and +50 μm was added to all AP coordinate for visualization only, since the actual coordinate is discretized by the 100 μm thickness of brain sections. Scale bars: 1 mm.
(c) Relationship between injection location into HF and the location of retrogradely labeled cells in HD. Every symbol indicates a pair of injections at different coordinates in the same brain. X-axis is the difference in injection coordinate along the AP axis, and y-axis is the difference in the mean coordinate of labeled cells in HD, measured along the main topographic axis. Slope indicates that for every 1 mm shift of the hippocampal injection in the anterior direction, the mean of HD label shifts 0.33 mm along the main topographic axis. Note that the plot is symmetric around (0,0) because for each pair of injections we plot both the comparison of the anterior injection to the posterior one and vice versa.
(d-f) Analysis of LC, shown as in (a-c). Note that anterior injections labeled cells that were significantly more posterior (p<0.005, linear mixed-effects model). Injections were at locations 2 and 4 (Table 1). Scale bars: 250 μm.
(g) Coefficient of the linear mixed-effects model, which quantifies the effect of injection location on the location of retrogradely labeled cells. This coefficient is normalized by the overall size of the brain region and expresses percent shift along the topographic axis for every mm anterior shift of the injection location. Asterisks indicate regions for which was significantly different from zero (p<0.05). TnA and PMI were not included in this analysis because in both cases only two of the injection locations labeled any cells. About half of the regions are significantly topographic in this analysis.
(h) The orientations of the topographic axes for the brain areas that were significantly topographic in (g). Cone indicates the direction of the topographic axis in stereotaxic coordinates. Width of the cone indicates standard error of this estimate (note that standard error can be different in different directions, making the base of the cone an ellipse).

