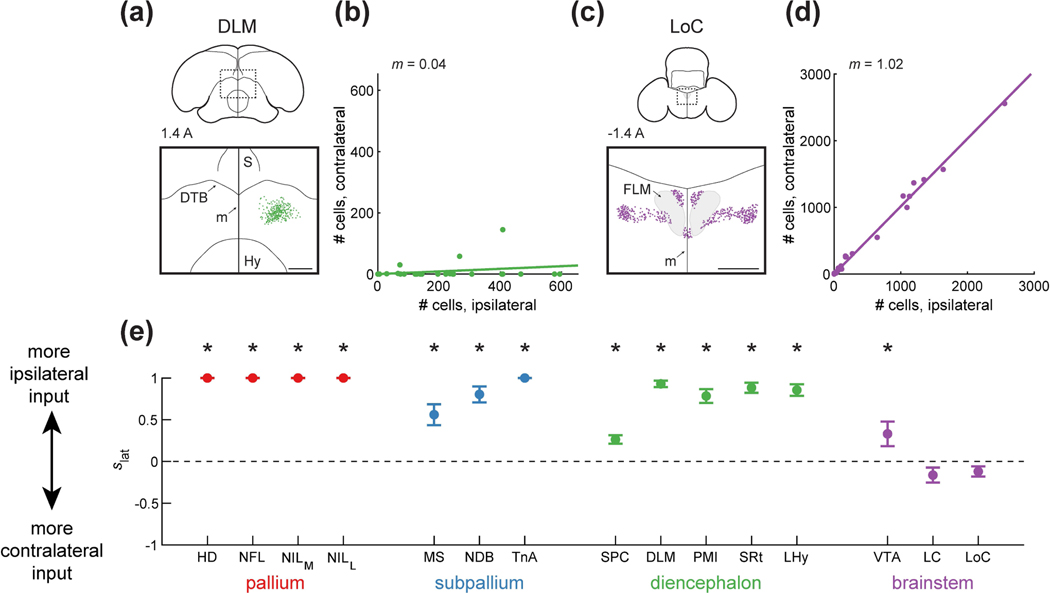
Figure 7: Ipsilateral and contralateral contribution of different inputs to HF.
(a) Top: schematic of a coronal section, with the region of interest shown by a dotted rectangle. The region of interest is centered on the midline to compare any ipsilateral and contralateral label. Bottom: retrogradely labeled cells. HF receives input predominantly from ipsilateral DLM. Injection was at location 7 (Table 1). Coordinate 1.4 A is in mm anterior to lambda. Scale bar: 500 μm.
(b) Comparison of the number of cells labeled ipsilaterally and contralaterally. Line is a linear fit with the slope () indicated. In the case of DLM, slope is smaller than 1, indicating that there was significantly more ipsilateral label (p<0.001, Wilcoxon signed-rank test).
(c) Labeling of LoC, shown as in (a). HF receives input from both contralateral and ipsilateral hemispheres. Injection was at location 7 (Table 1). Scale bar: 500 μm.
(d) Analysis LoC, shown as in (b). The slope is not significantly different from 1, indicating similar labeling of ipsilateral or contralateral cells (p=0.14, Wilcoxon signed-rank test).
(e) Ipsilateral score , defined as 1 for a completely ipsilaterally projecting region and −1 for a completely contralaterally projecting region. Mean ± SEM is shown for all regions. Asterisks indicate regions for which was significantly different from 0 (p<0.05). Pallial, subpallial, diencephalic, and midbrain (VTA) inputs were predominantly ipsilaterally projecting, while the hindbrain (LC and LoC) contributed input from both the ipsilateral and the contralateral hemispheres.

