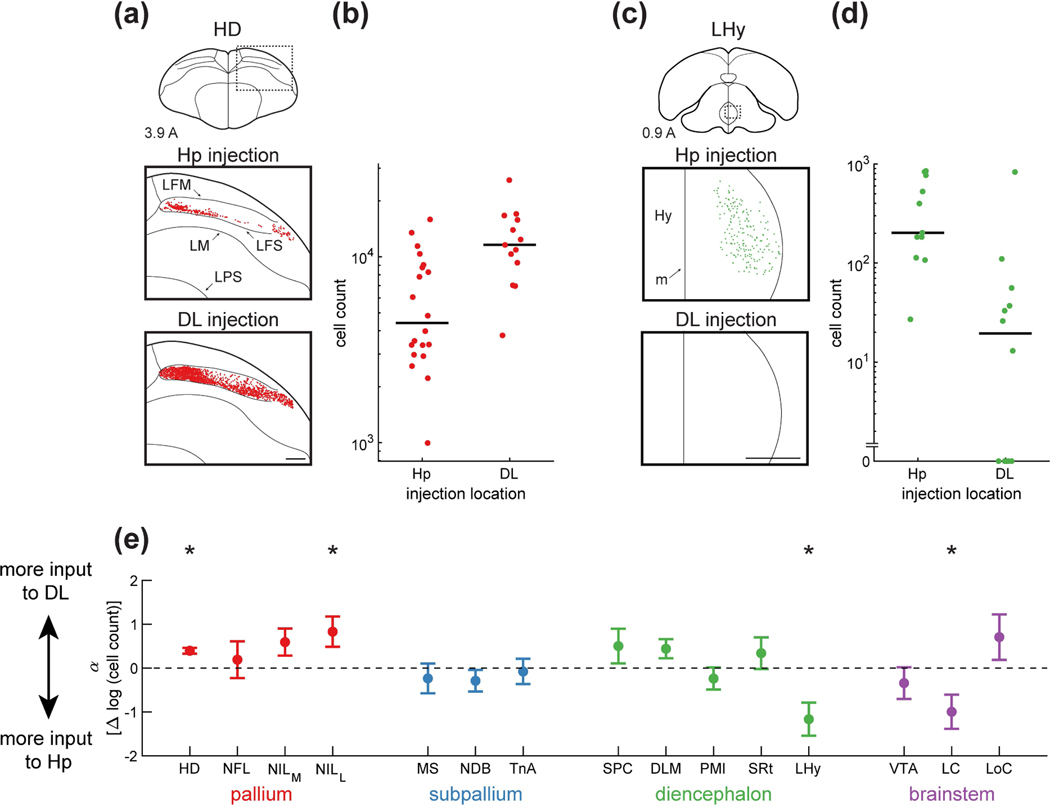
Figure 8: Inputs to HF differentially target DL and Hp.
(a) Top: schematic of a coronal section, with the region of interest shown by a dotted rectangle. Middle and bottom: retrogradely labeled neurons from a paired Hp injection and DL injection. Examples are from the same coronal section of the same brain. There were more cells labeled by the DL injection than by the Hp injection. Injections were at locations 3 and 6 (Table 1). Coordinate 3.9 A is in mm anterior to lambda. Scale bar: 500 μm.
(b) The number of cells retrogradely labeled by each Hp and DL injection. Data are pooled from all positions along the long axis. In the case of HD, there were significantly more HD cells projecting to DL than to Hp (p<0.001, linear mixed-effects model). Horizontal lines indicate medians.
(c) Labeling of LHy, shown as in (a). Note the absence of any retrogradely labeled cells from the DL injection. Injections were at locations 4 and 7 (Table 1). Scale bar: 500 μm.
(d) Analysis of LHy, shown as in (b). There were significantly more cells projecting to Hp than to DL (p<0.01, linear mixed-effects model).
(e) Parameter of the linear mixed-effects model, which quantifies the difference in retrograde labeling between DL and Hp injections. An increase of 1 in this parameter corresponds to a 10-fold increase in the number of cells retrogradely labeled by DL injections relative to Hp injections. Mean ± bootstrap SEM is shown for all regions. Asterisks indicate regions for which was significantly different from zero (p<0.05). Three of the four pallial regions projected predominantly to DL while two subcortical regions projected predominantly to Hp.

