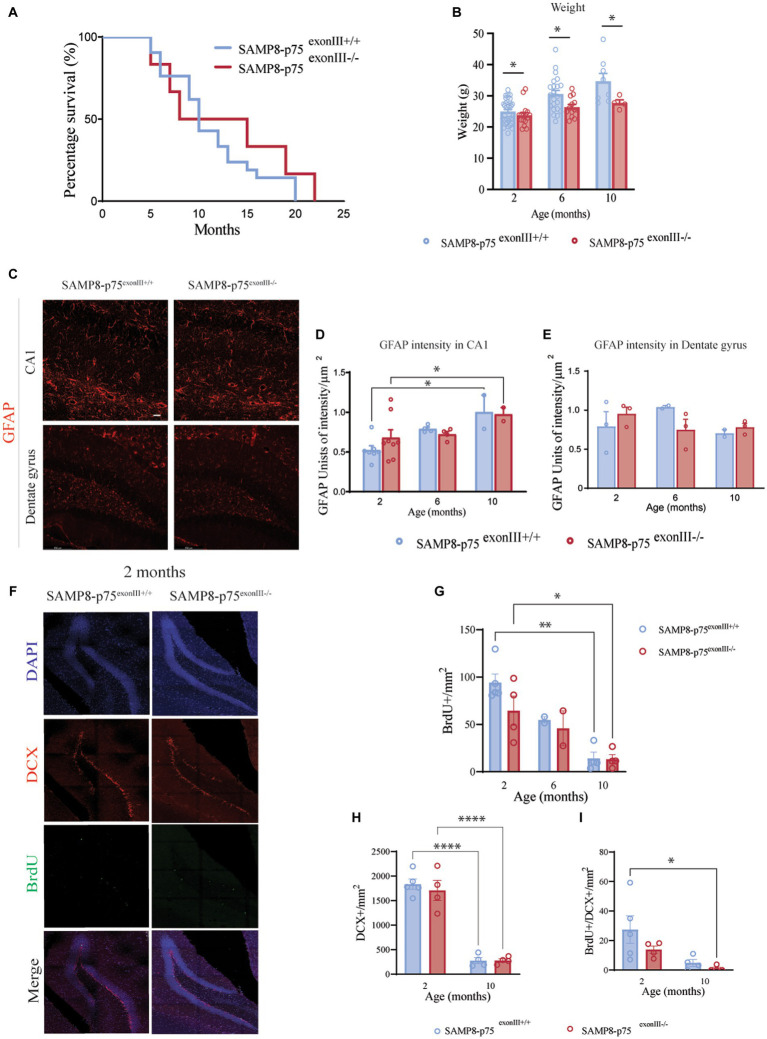
Figure 1.
Characterization of SAMP8-p75exonIII−/− mice. (A) Survival Kaplan plot showing no significant differences between SAMP8-p75exonIII+/+ (N = 21, mean half-life =10 months) and SAMP8-p75exonIII−/− (N = 12, mean half-life = 11.5 months), Log-rank (Mantel-Cox) test, ns. (B) Bar plot showing the weight of the two mice genotypes at different ages. The bars represent the standard error of the mean, N = 8. Two-way ANOVA followed by Tukey’s posthoc analysis, ***p < 0.001. (C) Hippocampal astroglyosis. Representative images of the GFAP staining in the CA1 and dentate gyrus at 2 months. Scale bars, 25 μm. (D) Quantification of GFAP intensity in the CA1 region of the hippocampus at 2, 6, and 10 months. The bars represent the standard error of the mean, N > 3. Two-way ANOVA followed by Tukey’s posthoc analysis, **p < 0.05. (E) Quantification of GFAP intensity in the dentate gyrus region of the hippocampus at 2, 6, and 10 months. The bars represent the standard error of the mean, N > 3. Two-way ANOVA followed by Tukey’s posthoc analysis, **p < 0.01. (F) Hippocampal neurogenesis. Representative images of the staining of BrdU+/DCX+ cells in the SGZ of the dentate gyrus of SAMP8-p75exonIII+/+ and SAMP8-p75exonIII−/− mice; N = 4, four brain sections per animal. (G) Quantification of the number of BrdU+ cells in the SGZ of the dentate gyrus at 2, 6 and 10 months of age. (H) Quantification of the number of DCX+ cells in the SGZ of the dentate gyrus at 2 and 10 months of age. (I) Quantification of the number of BrdU+/DCX+ cells in the SGZ of the dentate gyrus at 2 and 10 months of age. Two-way ANOVA followed by Tukey’s posthoc analysis, *p < 0.05, **p < 0.01, ***p < 0.001, ****p < 0.0001.

