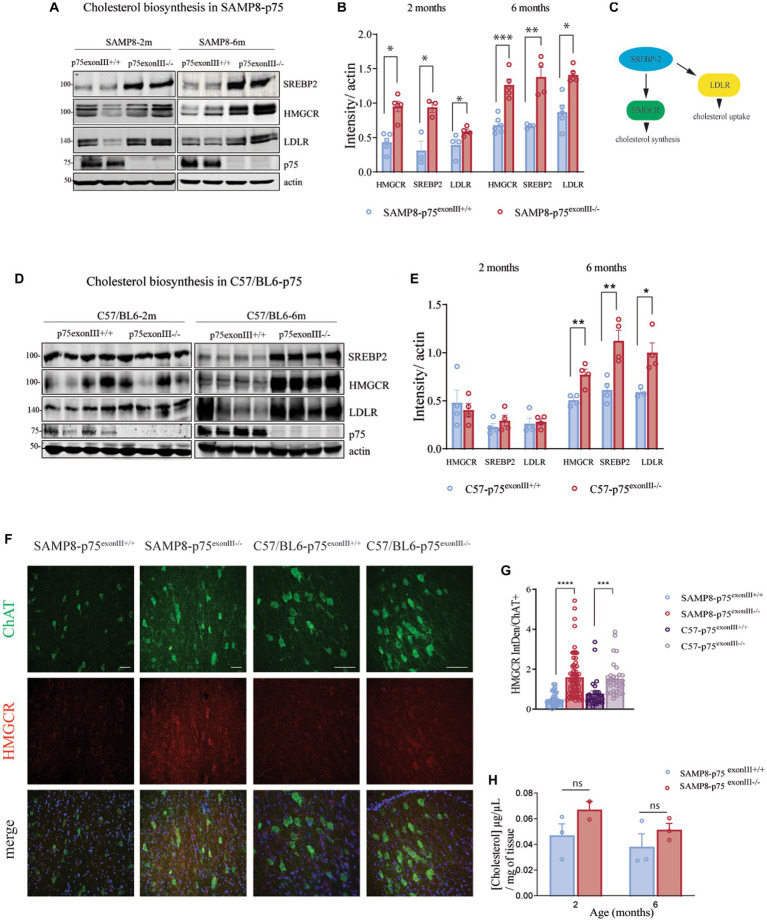
Figure 6.
Upregulation of cholesterol biosynthesis genes in the p75exonIII −/− mice strains. (A) Western blot analysis of basal forebrain extracts from 2 and 6 months old SAMP8-p75exonIII+/+ and SAMP8-p75exonIII−/− mice showing expression of SREBP2, HMGRC, and LDLR (N = 4). (B) Quantification of the western blots showed in (B). (C) Scheme showing the relationship between SREBP2, LDLR, and HMGRC. (D) Western blot analysis of basal forebrain extracts from 2 and 6 months old C57BL6-p75exonIII+/+ and C57BL6-p75exonIII−/− mice showing expression of SREBP2, HMGRC and LDLR (N = 4). (E) Quantification of the western blots showed in (D). (F) Immunofluorescence of basal forebrain slides showing the co-expression of ChAT and HMGRC in SAMP8-p75exonIII−/− and 6 months old C57BL6-p75exonIII−/− Scale bars, 50 μm. (G) Quantification of HMGCR levels in ChAT positive neurons. Each point indicates a ChAT positive cell. Statistical analysis was performed using a t-test, ***p < 0.001, ****p > 0.0001. (H) Cholesterol levels of basal forebrain extracts from SAMP8-p75exonIII+/+ and SAMP8-p75exonIII−/− mice at 2 and 6 months old.

