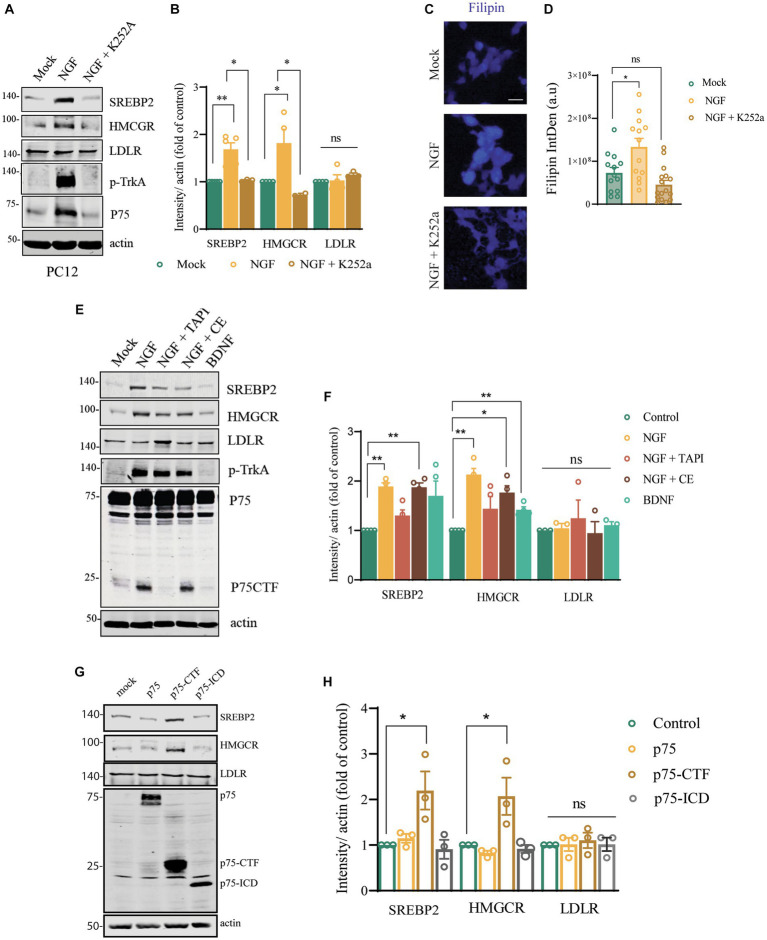
Figure 7.
Cleavage of p75 mediated by TrkA/NGF signaling modulates cholesterol biosynthesis genes in PC12 cells. (A) Western blot analysis of PC12 lysates stimulated with NGF (50 ng/mL) for 24 h showing the expression of SREBP2, HMGRC, LDLR, p-TrkA and p75. (B) Quantification of the western blot showed in (A). Mean ± _SEM, N < 4. For data presented as a fold increase, the One-sample t test and paired t-test was employed, *p < 0.05, **p < 0.01, ***p < 0.001. (C) Filipin staining of PC12 stimulated with buffer, NGF (50 ng/mL) or NGF + K252a for 24 h. (D) Filipin intensity quantification. Each point represents a single cell. One-way ANOVA followed by Tukey’s posthoc test, *p < 0.05. (E) Western blot analysis of PC12 lysates stimulated with NGF (50 ng/mL) and TAPI-1, Compound E or BDNF for 24 h showing the expression of SREBP2, HMGRC, LDLR, p-TrkA and p75. (F) Quantification of the western blot showed in (D). Mean ± _SEM, N < 4. For data presented as a fold increase, the One-sample t test and paired t-test was employed *p < 0.05, **p < 0.01, ***p < 0.001. (G) Western blot analysis of PC12-TrkA/p75-DKO cells transfected with mock, p75 full length, p75-CTF and p75-ICD showing the expression of SREBP2, HMGRC, LDLR and p75. (H) Quantification of the western blot showed in (G). Mean ± _SEM, N < 4. The One-sample t test and paired t-test was employed, *p < 0.05, **p < 0.01, ***p < 0.001.

