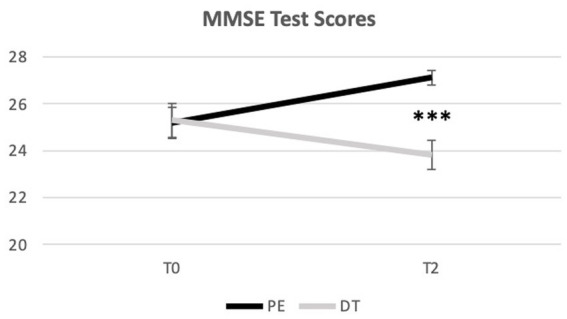
Figure 4.

Distribution of the MMSE mean score over time (from T0 to T2). ***Indicate significant differences for p < 0.001. Error bars represent standard errors. Only Between group differences are portrayed. For differences Within groups, please see Table 3.
