
Fig. 3. Non-fasted plasma metabolites show similar variance within Nile rats and lower variance within each metabolite compared to fasted sampling.
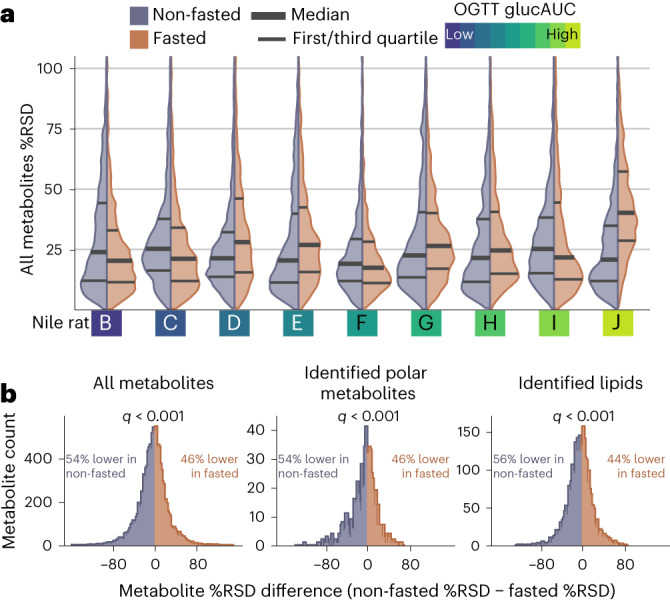
a, Comparison of %RSD distributions for non-fasted and fasted plasma metabolites within each Nile rat across triplicate plasma sampling. A total of five out of nine Nile rats show lower median %RSD in non-fasted sampling. Overall median %RSD in non-fasted sampling is 22.2%, compared to overall median %RSD of 24.9% in fasted sampling. Nile rats are ordered on the basis of OGTT glucAUC, with more glucose-intolerant Niles rats to the right. b, Calculating %RSD in each sampling method and then subtracting non-fasted %RSD from fasted %RSD for each metabolite in all Nile rats yields percentage point differences. Distribution of percentage point differences are shown, where the blue portion on the left are metabolites whose %RSD difference is less than 0%, that is, it has a lower %RSD in non-fasted metabolites. Across all metabolites, 54% of matched measurements have lower non-fasted %RSD. Across identified polar metabolites, 54% are lower in non-fasted samples and in identified lipids, and 56% are lower in non-fasted samples. Significance testing using Wilcoxon signed rank test reveals that the median for each distribution significantly differs from 0% (q < 0.001 for all three distributions).