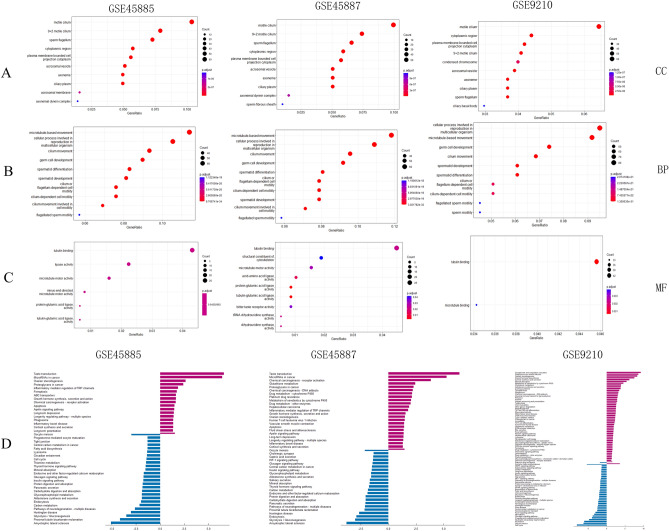
Figure 2.
GO and KEGG enrichment analysis. GO term “cellular component (CC)” (A), GO term “biological process (BP)” (B) and GO term “molecular function (MF)”(C) for DEGs in GSE45585, GSE45587 and GSE9210 datasets. The size of the circle indicates the number of genes enriched in each GO term pathway. The red colour represents a lower P value. Blue represents higher. KEGG pathways enriched in GSE45585, GSE45587 and GSE9210 datasets (D). Blue: down-regulated DEGs enriched; Purple: up-regulated DEGs enriched.

