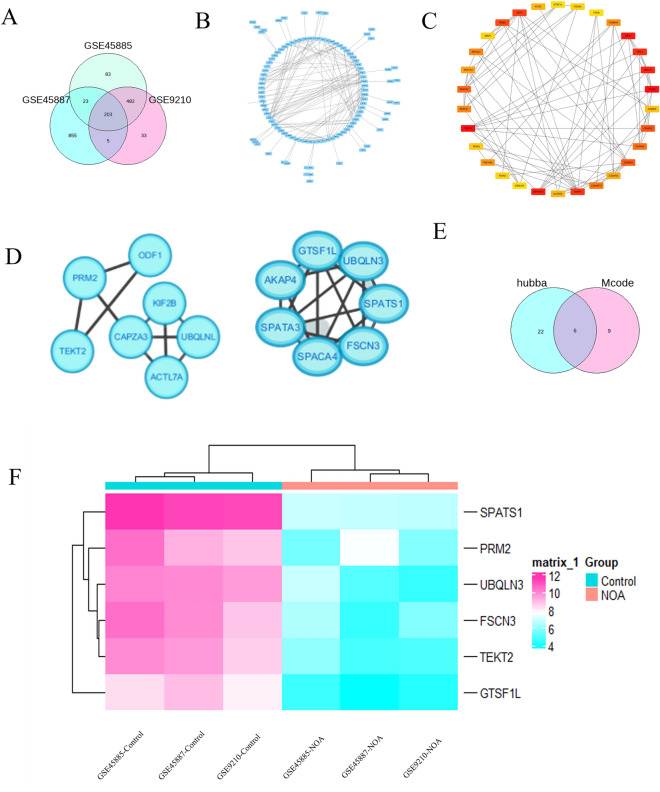
Figure 4.
Identification of hub genes. A Venn diagram of 203 overlapping DEGs in GSE45585, GSE45587 and GSE9210 datasets (A). PPI network constructed by 203 DEGs in STRING database with a PPI score > 0.4 (B). As a result, the PPI network showed 59 interactions of the hub genes with each other, 197 nodes and 271 edges were established. Three functional modules were identified using Cytoscape software by Hubba plugin analysis (C) and the MCODE (D). Six hub genes with the highest scores in the Degree, Bottleneck, and MCC algorithms from Hubba and MCODE analysis were identified (E). Six identified hub genes including PRM2, FSCN3, TEKT2, UBQLN3, SPATS1 and GTSF1L were all down-regulated in NOA compared to the normal samples (F).

