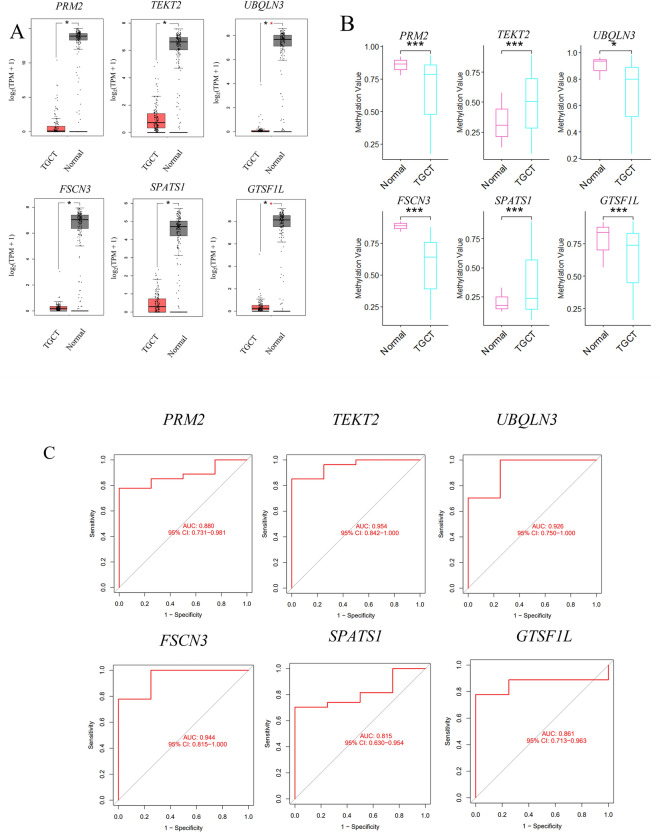
Figure 7.
Analysis of six hub genes in TGCTs from the TGCA database. Boxplots of six hub genes expression in TGCTs from TGCA database (A). PRM2, TEKT2, FSCN3, UBQLN3, SPATS1 and GTSF1L were significantly down-regulated in TGCT samples compared to normal controls. *P < 0.05. Methylation levels of 6 hub genes in TGCT and control groups (B). The methylation levels of PRM2, TEKT2, FSCN3, UBQLN3, SPATS1 and GTSF1L were significantly changed in TGCT samples compared to normal controls (P < 0.05). Among them, the methylation levels of PRM2, FSCN3, UBQLN3 and GTSF1L were significantly increased in TGCT compared to normal samples, while the mean methylation levels of TEKT2 and SPATS1 were decreased (P < 0.05). ROC analysis showed six hub genes showed good prognostic value with an area under the curve (AUC) ≥ 0.7 (C). TEKT2 (AUC = 0.954, 95% CI: 0.842–1.000; PRM2 (AUC = 0.880, 95%CI: 0.731–0.981); FSCN3 (AUC = 0.944, 95% CI: 0.815–1.000); UBQLN3(AUC = 0.926, 95% CI: 0.750–1.000); SPATS1(AUC = 0.815, 95% CI: 0.630–0.954); GTSF1L (AUC = 0.861, 95% CI: 0.713–0.963).

