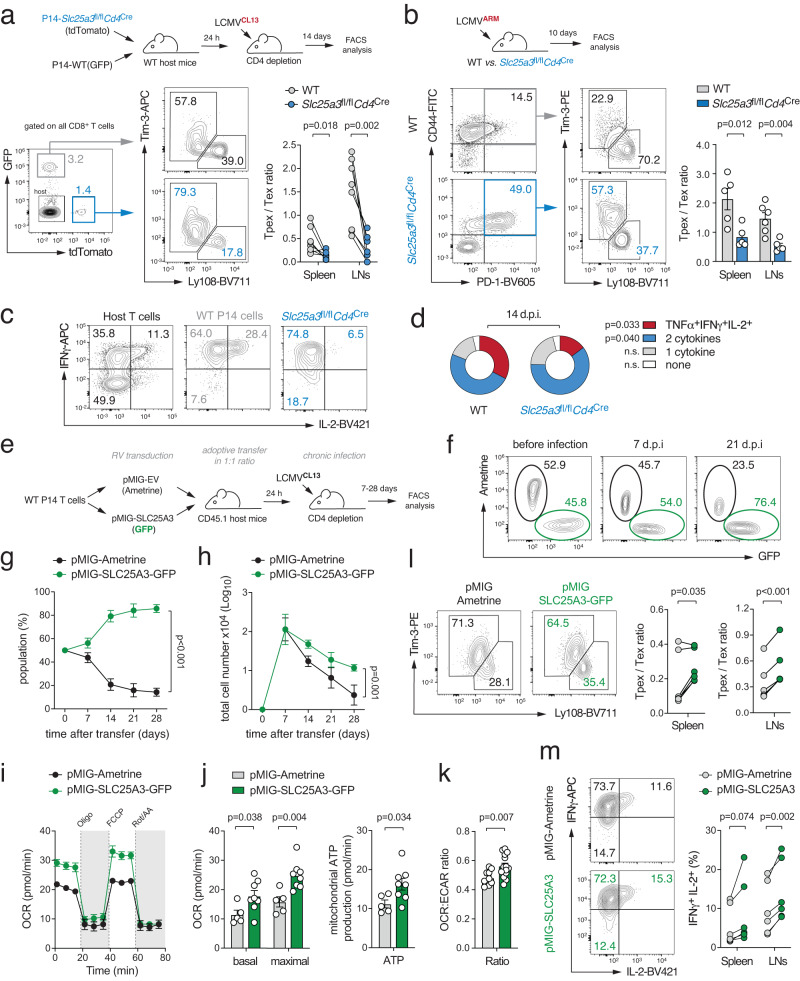
Fig. 3. Mitochondrial respiration controls the functional exhaustion of virus-specific T cells.
a Adoptive co-transfer of GFP+ WT and tdTomato+ mPiC-deficient (Slc25a3fl/flCd4Cre) P14 T cells into C57BL/6 mice before chronic infection with LCMV clone 13 (LCMVCL13). Flow cytometric analysis of Tpex and Tex cells in spleen and LNs of the host mice 14 days post infection (d.p.i.); n = 8 mice. b Acute infection of WT and Slc25a3fl/flCd4Cre mice with LCMV Armstrong (LCMVARM). Analysis of Tpex and Tex cells was performed 10 d.p.i.; means ± SEM of 5 mice. c, d Analysis of TNFα, IFNγ, and IL-2 expression after PMA/iono restimulation of WT and mPiC-deficient P14 T cells after co-transfer into chronically infected mice; means ± SEM of 6–10 mice. e–m Ectopic expression of mPiC attenuates T cell exhaustion. e Retroviral transduction of WT P14 T cells with GFP+ SLC25A3/mPiC or Ametrine+ empty vector followed by adoptive co-transfer into chronically infected mice. f Representative flow cytometric analysis of GFP+ and Ametrine+ P14 T cells after transfer into LCMVCL13 infected CD45.1+ mice. g, h Relative and absolute numbers of GFP+ and Ametrine+ P14 T cells in the spleens; means ± SEM of 2-6 mice. i, j Basal and maximal oxygen consumption rate (OCR) (i) and mitochondrial ATP production rate (j) in mPiC (GFP+) and empty vector (Ametrine+) transduced P14 cells ex vivo 7 d.p.i. using a Seahorse extracellular flux analyzer; means ± SEM of 3 mice analyzed in 2-3 technical replicates. k Ratio of OCR to extracellular acidification rate (ECAR) in mPiC overexpressing versus empty vector T cells; means ± SEM of 3 mice analyzed in 5 technical replicates. l Flow cytometric analysis of Tpex and Tex cell ratio in mPiC (GFP+) and empty vector transduced (Ametrine+) P14 cells 7 d.p.i.; n = 6 mice. m IFNγ and IL-2 expression in mPiC and empty vector transduced P14 cells after restimulation 7 d.p.i.; means ± SEM of 6 mice. Paired and two-tailed unpaired Student’s t-test in (a), (b), (d), and (i–m) or 2-way ANOVA in (g, h).

