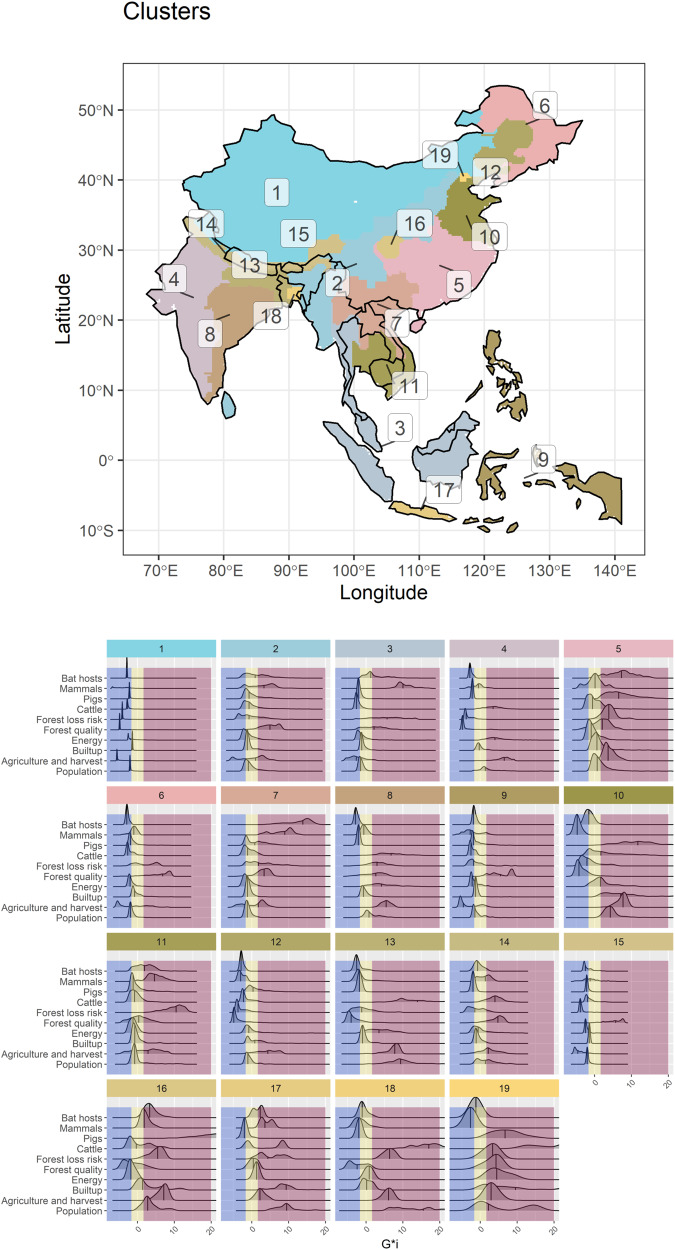
Fig. 3. Distribution of clusters of risk factors associated with potentially new emerging SARS-like coronaviruses. The values include all potential mammalian hosts, land use change, and human exposure density distributions (Scenario 4).
Areas located in the red zone represent hotspots, yellow zones are intermediate areas, and coldspots are in blue at a 95% alpha error level. A map with country (black lines) labels is shown in Supplementary Fig. 8.

