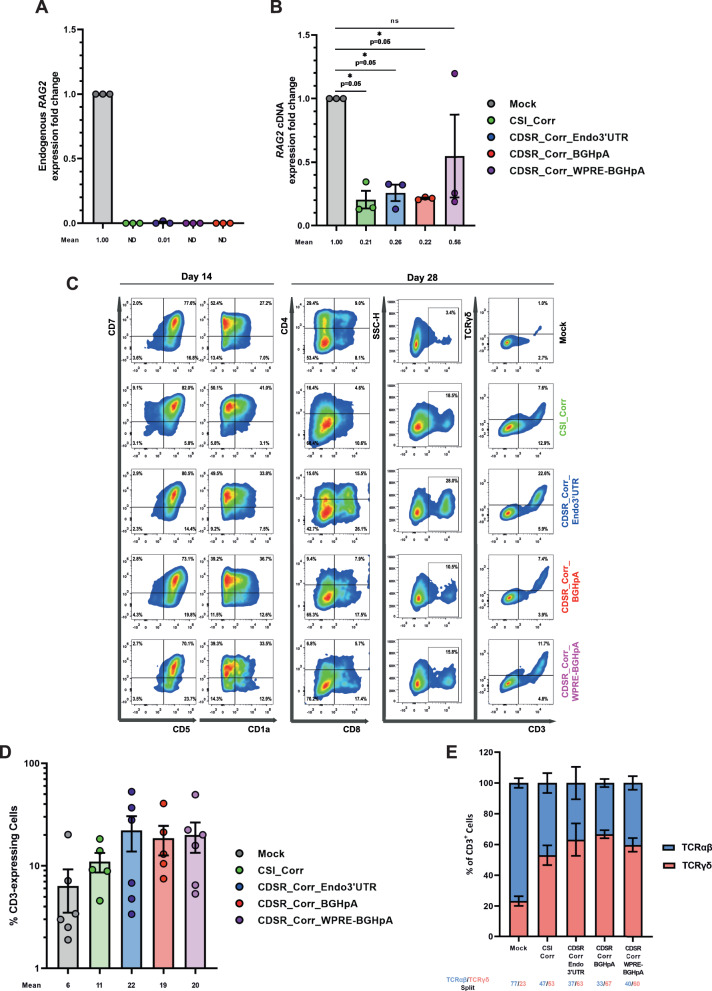
Fig. 4. IVTD of KI-KO correction simulation cells produces CD3+TCRγδ+ and CD3+TCRαβ+ T cells.
A qRT-PCR quantification of endogenous RAG2 gene expression in the RAG2 KI-KO cells compared to Mock cells on day 28 of IVTD (using green primer pair depicted in Supplementary Fig. 10A). Expression fold change is plotted relative to Mock and samples with no expression detected are plotted as not determined (ND). (N = 3 biologically independent samples). Data are represented as mean ± SEM. B qRT-PCR quantification of total RAG2 expression in the RAG2 KI-KO cells compared to Mock cells on day 28 of IVTD (using red primer pair depicted in Supplementary Fig. 10A). Expression fold change is plotted relative to Mock. (N = 3 biologically independent samples). Data are represented as mean ± SEM. * p < 0.05, ** p < 0.01, *** p < 0.001, and **** p < 0.0001 (Mann-Whitney one-sided test). C Flow cytometry analysis of the T-cell developmental progression on days 14 and 28 of IVTD of Mock and KI-KO populations. Cells were stained for CD7, CD5, and CD1a expression on day 14 of IVTD and for CD4, CD8, CD3, and TCRγδ expression on day 28 of IVTD. Gating was determined by FMO + isotype controls. D Summary of CD3 expression by Mock and KI-KO populations on day 28 of IVTD. Mock (N = 6), CSI_Corr (N = 5), CDSR_Corr_Endo3’UTR (N = 6), CDSR_Corr_BGHpA (N = 5), and CDSR_Corr_WPRE-BGHpA (N = 6). Data are represented as mean ± SEM. E Division between TCRαβ- and TCRγδ-expressing CD3+ cells for Mock and KI-KO populations on day 28 of IVTD. Mock (N = 6), CSI_Corr (N = 5), CDSR_Corr_Endo3’UTR (N = 6), CDSR_Corr_BGHpA (N = 5), and CDSR_Corr_WPRE-BGHpA (N = 6). Data are represented as mean ± SEM. Source data are provided as a Source Data file.

