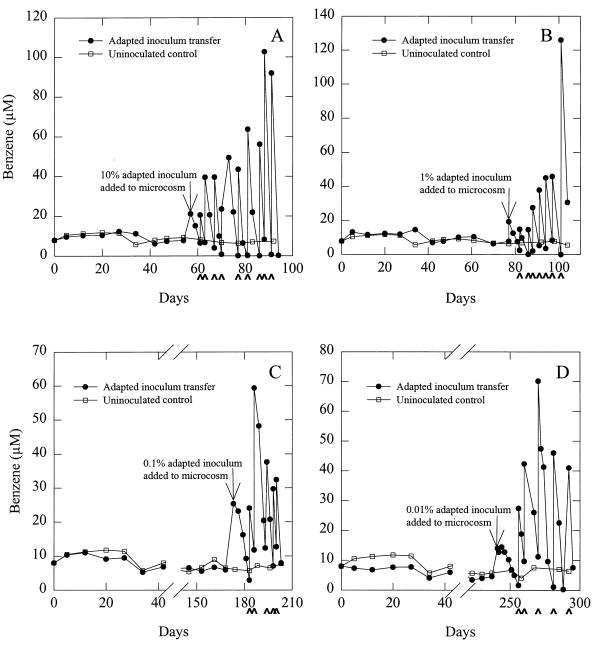
FIG. 1.
Benzene uptake in inoculated and uninoculated aquifer sediments. Arrowheads along the x axes indicate readditions of benzene. Arrows in the graphs indicate the times of inoculation. The inoculation procedure required opening the bottles under a stream of N2-CO2, which flushed benzene from the system. Thus, benzene had to be added back to the sediments, which accounts for the slight increases in benzene concentrations at the times of inoculation. The data are from one bottle for each treatment.

