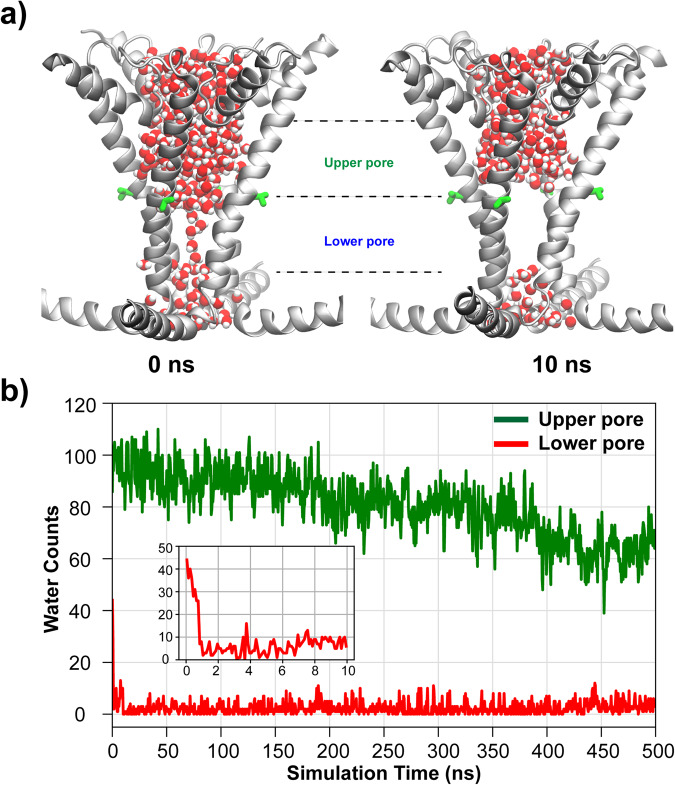
Fig. 2. Hydration of hTRPV4 pore during atomistic simulations.
a Representative snapshots of hTRPV4 pore in wet (0 ns) and dry (10 ns) states. Only the pore helix, S6 and TRP helices are shown for clarity. Pore waters are shown using balls with oxygens and hydrogens colored in red and white, respectively. b Numbers of water molecules in the upper and lower pore regions as a function of simulation time during one of three unrestrained simulations. The upper and lower pore regions are defined using the Cα positions of V700, V708 and M718. The insert shows the water count in the lower pore during the first 10 ns.

