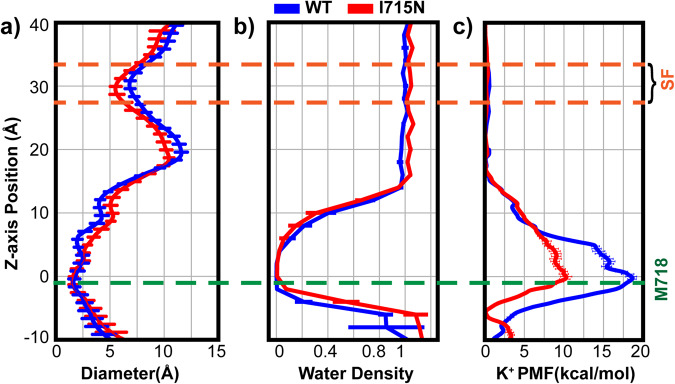
Fig. 3. hTRPV4 pore profile, hydration propensity and K+ permeation free energy in the WT and I715N systems.
a The pore diameter and b water density profiles were calculated using the last 100 ns trajectories of simulations of the WT and I715 mutant hTRPV4 channels (see Methods). The error bars plot the standard deviations within the trajectories. c The K+ ion permeation PMFs were calculated from umbrella sampling simulations (for single ion region, −20 Å to 20 Å) and equilibrium MD simulations (elsewhere) (see Methods). The error bars plot the difference between results from the first and second halves of these trajectories. In all panels, the zero position is the lower gate location, defined as the backbone center of mass of residues 715−718. The yellow and green dash lines mark the z-axis positions of the selectivity filter (SF) and the narrowest constriction (near M718).

