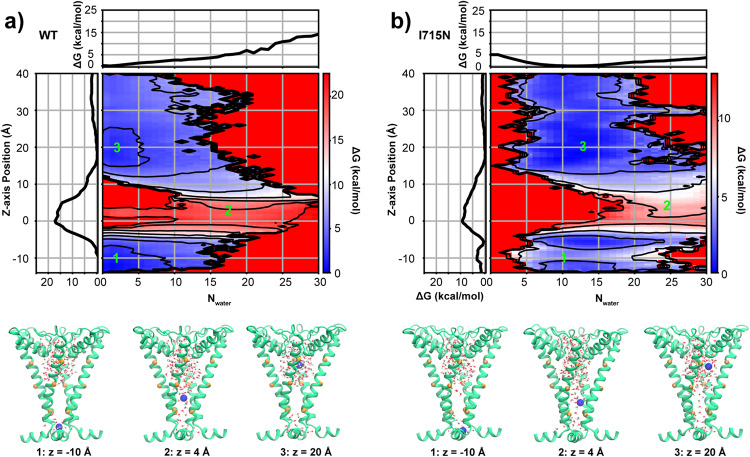
Fig. 5. 2D PMFs of the K+ permeation in WT.
a and I715N mutant b. hTRPV4 channels, as a function of the water number in the lower pore region and z distance of the ion to the lower gate. The results were calculated from the umbrella sampling trajectories using WHAM. Both 2D PMFs were shifted just so that the minima at z ~ 20 Å is at zero. Contour lines are plotted every 3 kcal mol−1. Representative snapshots at three critical points (−10 Å, 4 Å and 20 Å, also marked as 1, 2, 3 on the top panel) are shown on the lower panel, where only PH and S6 helices are depicted as cartoons for clarity with K+ and water molecules inside the pore. The Cα atoms of V700, V708 and M718 are represented as orange spheres.

