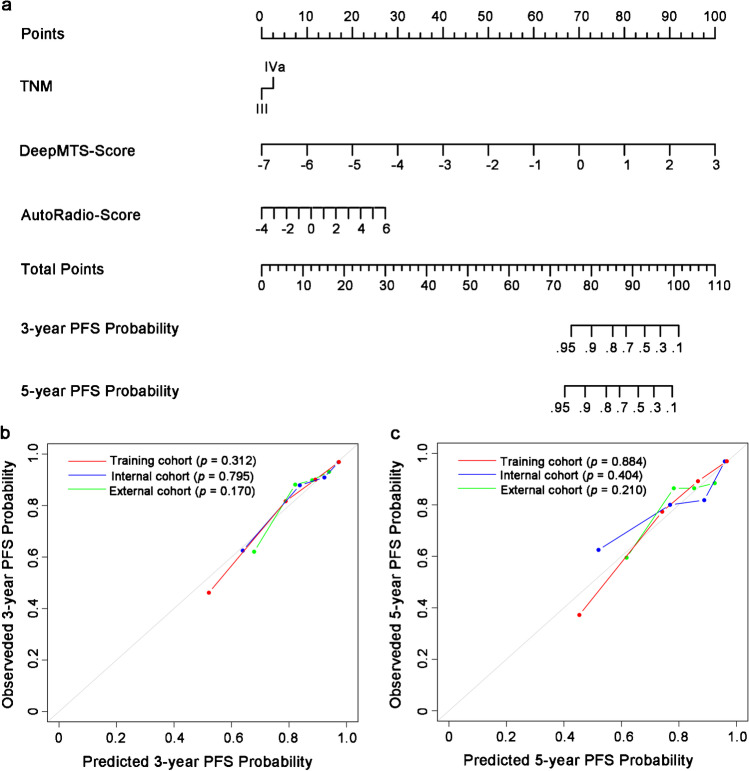
Fig. 2.
Nomogram and calibration curves. a An integrated MTDLR nomogram was built with TNM stage, DeepMTS-derived prognostic prediction score (DeepMTS-Score), and DeepMTS-derived automatic radiomics score (AutoRadio-Score) to predict 3-year and 5-year PFS probability. For calculating the 3-year and 5-year PFS probability with the nomogram, firstly, we locate the patient’s TNM stage and draw a line straight upward to the “Points” axis to determine the points associated with the corresponding TNM stage. Then, we repeat the process for DeepMTS-Score and AutoRadio-Score, and sum the total points achieved for the three covariates. Lastly, we locate this sum on the “Total Points” axis, and draw a line straight down to determine the probability of 3-year and 5-year PFS. b The 3-year and c 5-year PFS calibration curves of the integrated MTDLR nomogram in the training, internal validation, and external validation cohorts. The actual PFS probability is plotted on the y-axis, while nomogram predicted probability is plotted on the x-axis. The P value of calibration was calculated by Hosmer–Lemeshow goodness-of-fit test, and P value > 0.05 indicates the good match between the actual and predicted PFS probability

