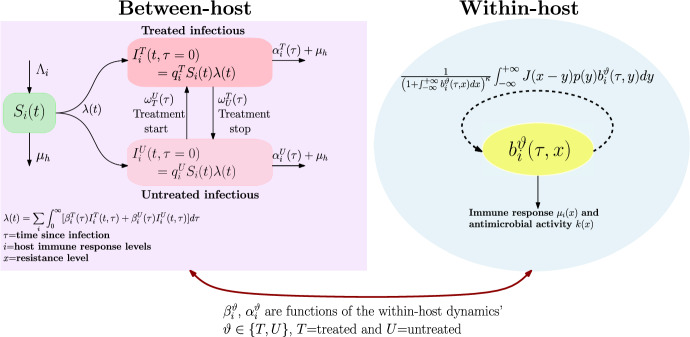
Fig. 1.
Flow diagram of the nested model. Within-host model: the number of bacteria produced at time with resistance level x is , where is the probability for a bacterial with resistance level to mutate towards a level and p(y) is the bacterial intrinsic growth rate. Bacterial cells with resistance level x, within an individual with immune system level i are cleared either by the immune system at rate or by the antimicrobial efficiency at rate k(x). Between-host model: susceptible individuals are recruited at a constant rate . and are respectively treated and untreated infected individuals at time t, which are infected since time . The force of infection in the whole population at time t is , with the disease transmission rate of an infected individual -time post infection. At the time t, new infections occur at rate , and are either treated with a probability or untreated with a probability . The natural death rate of individuals is . If infected since time , the loss rate is . Untreated individuals, and infected since time start the treatment at rate while treated individuals stop the treatment at rate

