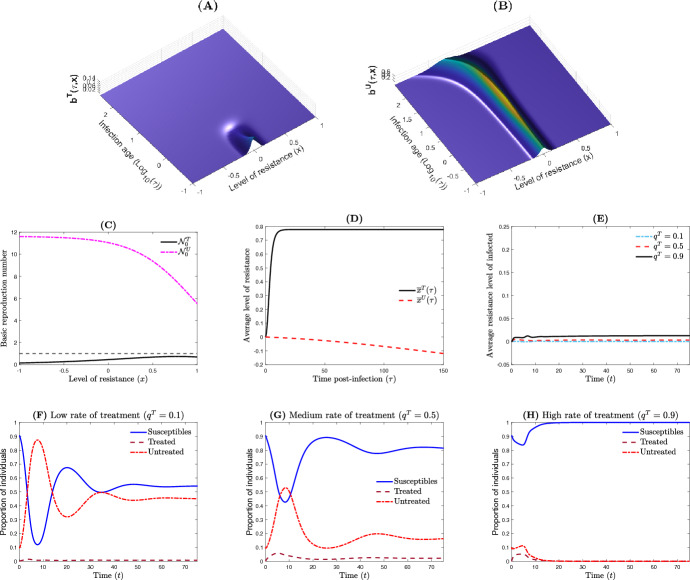
Fig. 3.
Dynamics of the nested model when the therapeutic treatment is successful. A, B The bacterial population (treated and untreated) with respect to time and resistance level x. C The basic reproduction numbers at the within-host level and , with and without drug respectively. D The average resistance level , of the infected host. E The average resistance level of the host population. F–H The between-host dynamics with respect to the treatment rate where , 2.6750 and 0.5685, respectively. Parameter values are and , , , , ,

